[DAILY TRADING]: Brent Crude Oil Tops $92 as Hormuz Standoff Drags On
 Updated Updated Wed, 2026 August 19 09:02
![[DAILY TRADING]: Brent Crude Oil Tops $92 as Hormuz Standoff Drags On](https://www.vantagemarkets.co.id/en/wp-content/uploads/sites/22/2026/08/UKOUSD-USOUSD-Daily-Analysis-August-19-2026.webp)
Here’s a number that caught my eye this morning: three. That’s how many ships crossed the Strait of Hormuz on Sunday, against a five-day average of just 12, itself a fraction of the roughly 130 vessels crossing daily before the conflict began in February. Everything else in today’s crude oil price story flows from that one data point. Brent crude oil (UKOUSD) traded at $92.36 a barrel and WTI crude oil (USOUSD) traded at $85.63 a barrel as of 11:30 (GMT+8) on 19 August 2026, based on the Vantage CFD feed, both extending a climb running several sessions now.
I won’t pretend to know where oil goes next; nobody really does when the driver is geopolitics, not a spreadsheet. What I can do is walk you through what today’s oil price chart shows, and why. Weekly US crude oil inventories land this evening, with the FOMC minutes following in the early hours of Thursday (GMT+8).
Key Points
- Brent crude oil price and WTI crude oil price have both climbed for several straight sessions, trading at $92.36 and $85.63 as of 11:30 (GMT+8) on 19 August 2026.
- Ship traffic through the Strait of Hormuz has slowed to a fraction of normal, with only three vessels crossing Sunday against a five-day average of 12.
- US crude oil inventories land this evening and the FOMC minutes follow in the early hours of Thursday (GMT+8), adding fresh catalysts on top of an already tense Middle East backdrop.
What Today’s Oil Price Chart Is Showing
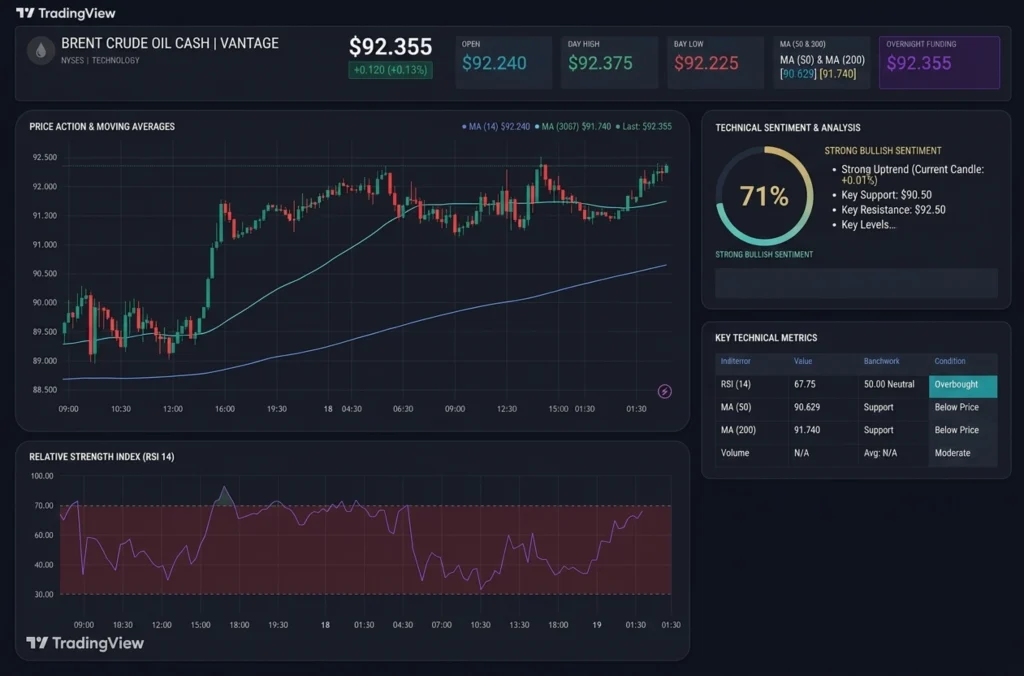
Brent crude oil (UKOUSD) opened at $92.240 and barely paused, printing a high of $92.375 and a low of $92.225 before last trading at $92.355, up 0.13% on the Vantage CFD feed as of 11:33 (GMT+8) on 19 August 2026. Price holds above both moving averages, near $91.740 and $90.629, and the RSI (14) reads 67.75 against a 57.18 signal line, attributed to the TradingView setup used for this analysis. Not overbought yet, but close.
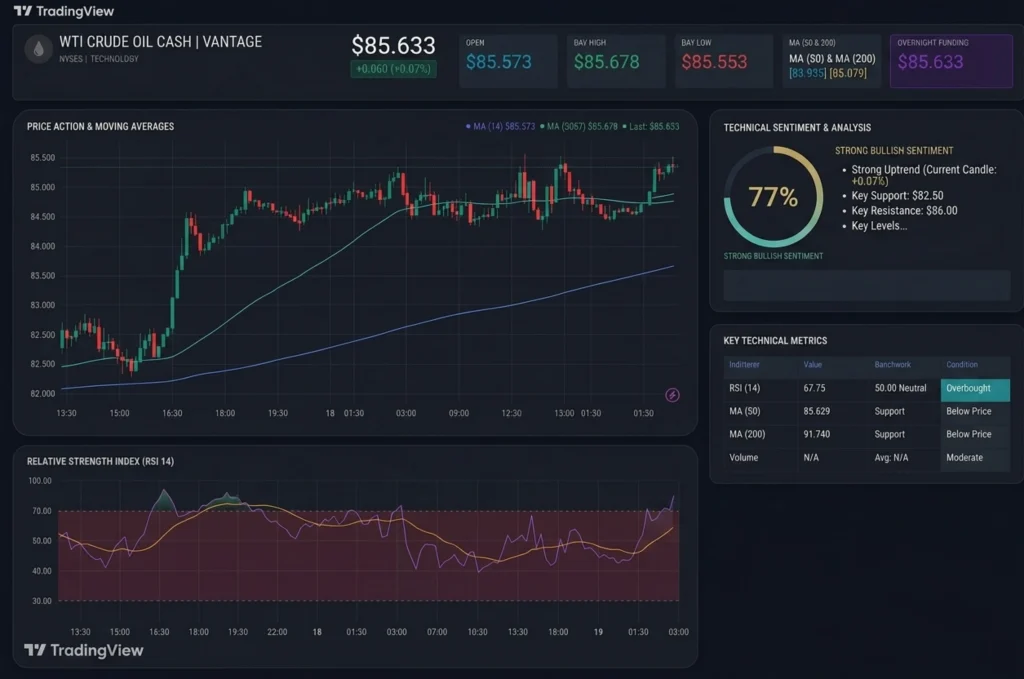
WTI crude oil (USOUSD) opened at $85.573, reached $85.678, and dipped to $85.553 before last trading at $85.633, up 0.07% as of 11:18 (GMT+8) on 19 August 2026. Its moving averages sit near $85.079 and $83.935, both sloping higher, and its RSI (14) reading of 70.51 against a 62.27 signal line has crossed into overbought territory, last touched earlier this week.
Today’s Session at a Glance
| Instrument | Open | High | Low | Last | Change % | RSI (14) |
| Brent (UKOUSD) | $92.240 | $92.375 | $92.225 | $92.355 | +0.13% | 67.75 |
| WTI (USOUSD) | $85.573 | $85.678 | $85.553 | $85.633 | +0.07% | 70.51 |
Source: Vantage CFD feed, TradingView. As of 11:33 (GMT+8) for Brent and 11:18 (GMT+8) for WTI, 19 August 2026. Indicative only.
Why Crude Oil Prices Are Climbing

The story hasn’t changed much this week, it’s just gotten louder. Brent fluctuated near $88.50 Monday, then climbed above $91 Tuesday for a third straight rising session, as the 60-day US-Iran negotiating window lapsed 17 August 2026 without a deal.2 September WTI futures and gasoline extended that rally into Tuesday’s close, posting a three-week high as the US and Iran remained deadlocked over the strait.3
Hormuz ship traffic slowed sharply that same weekend, with only three vessels transiting Sunday against a five-day average of 12, per Kpler data cited by CNBC.1 Iran and Oman continue negotiating a separate shipping arrangement without Washington, and Gulf producers appear to be routing more cargoes from outside the strait to keep any supply shock contained.2,7
The EIA’s Short-Term Energy Outlook, published 11 August 2026, pegs Brent’s third-quarter average near $85 a barrel, citing Hormuz-related disruptions of about 0.6 million barrels a day into next year.4 Brent already trades well above that baseline, pointing to markets pricing extra risk on top of the EIA’s own assumptions, not a fresh shock.
What Traders Are Watching Next
Two US releases dominate today’s commodity market news calendar: weekly EIA crude oil inventories and the FOMC minutes.5 Last week’s inventory report showed a 17.4 million barrel build, the largest since January 2023, so today’s number carries real scope to swing the complex either way.6
If you’re trading Brent and WTI Crude Oil CFDs, Hormuz headlines remain the factor to watch. A confirmed Iran-Oman shipping deal, or any sign Gulf producers are struggling to reroute cargoes, could move both benchmarks fast either way. Our Strait of Hormuz guide covers the mechanics behind this chokepoint. For ongoing coverage, follow our Brent Crude Oil News, WTI Crude Oil News, Crude Oil News Today, and Oil Price News Today tags as this story develops.
Managing Risk as Oil Swings on Headlines
Both benchmarks have moved several dollars this week, and most of that range is geopolitical risk premium, not a shift in supply and demand. That kind of move reverses fast on one headline out of Hormuz, Washington, or Tehran.
Both UKOUSD and USOUSD are trading inside ranges widened this week, and the next Hormuz headline, or tonight’s FOMC minutes, could move either instrument fast. A Stop Loss doesn’t remove that risk; it limits losses to a planned size, worth revisiting relative to today’s ranges before the data lands.
Leverage works both ways here, amplifying losses as quickly as gains. Position sizing relative to account equity, not any single price level, is worth checking ahead of tonight’s data, especially with exposure across both Brent and WTI at once.
RISK WARNING: CFDs are complex financial instruments and carry a high risk of losing money rapidly due to leverage. You should ensure you fully understand the risks involved and carefully consider whether you can afford to take the high risk of losing your money before trading.
Disclaimer: The information is provided for educational purposes only and doesn’t take into account your personal objectives, financial circumstances, or needs. It does not constitute investment advice. We encourage you to seek independent advice if necessary. The information has not been prepared in accordance with legal requirements designed to promote the independence of investment research. No representation or warranty is given as to the accuracy or completeness of any information contained within. This material may contain historical or past performance figures and should not be relied on. Furthermore estimates, forward-looking statements, and forecasts cannot be guaranteed. The information on this site and the products and services offered are not intended for distribution to any person in any country or jurisdiction where such distribution or use would be contrary to local law or regulation.
References
[1] “Trump won’t extend Iran ceasefire, threatens to ‘bomb’ Oman if it ‘gets in the way’ – CNBC” https://www.cnbc.com/2026/08/17/us-iran-war-trump-hormuz.html Accessed on 19 August 2026.
[2] “Brent Crude Oil – Price, Chart, Historical Data, News – Trading Economics” https://tradingeconomics.com/commodity/brent-crude-oil Accessed on 19 August 2026.
[3] “Crude Prices Gain on Reduced Middle Eastern Oil Supplies – Barchart” https://www.barchart.com/futures/quotes/CB*0/futures-prices Accessed on 19 August 2026.
[4] “Short-Term Energy Outlook – U.S. Energy Information Administration” https://www.eia.gov/outlooks/steo/ Accessed on 19 August 2026.
[5] “FOMC minutes, crude oil inventories among economic data due Wednesday – Investing.com” https://www.investing.com/news/stock-market-news/fomc-minutes-crude-oil-inventories-among-economic-data-due-wednesday-93CH-4865840 Accessed on 19 August 2026.
[6] “United States Crude Oil Stocks Change – Trading Economics” https://tradingeconomics.com/united-states/crude-oil-stocks-change Accessed on 19 August 2026.
[7] “Brent Crude Oil Futures Contracts – Oilprice.com” https://oilprice.com/futures/brent/ Accessed on 19 August 2026.