[DAILY TRADING] Nasdaq 100 21 August 2026 – Climbs Back to 29,347 as Wall Street Waits on Jackson Hole
 Updated Updated Fri, 2026 August 21 09:04
![[DAILY TRADING] Nasdaq 100 21 August 2026 – Climbs Back to 29,347 as Wall Street Waits on Jackson Hole](https://www.vantagemarkets.co.id/en/wp-content/uploads/sites/22/2026/08/NAS100-Daily-Analysis-August-21-2026.webp)
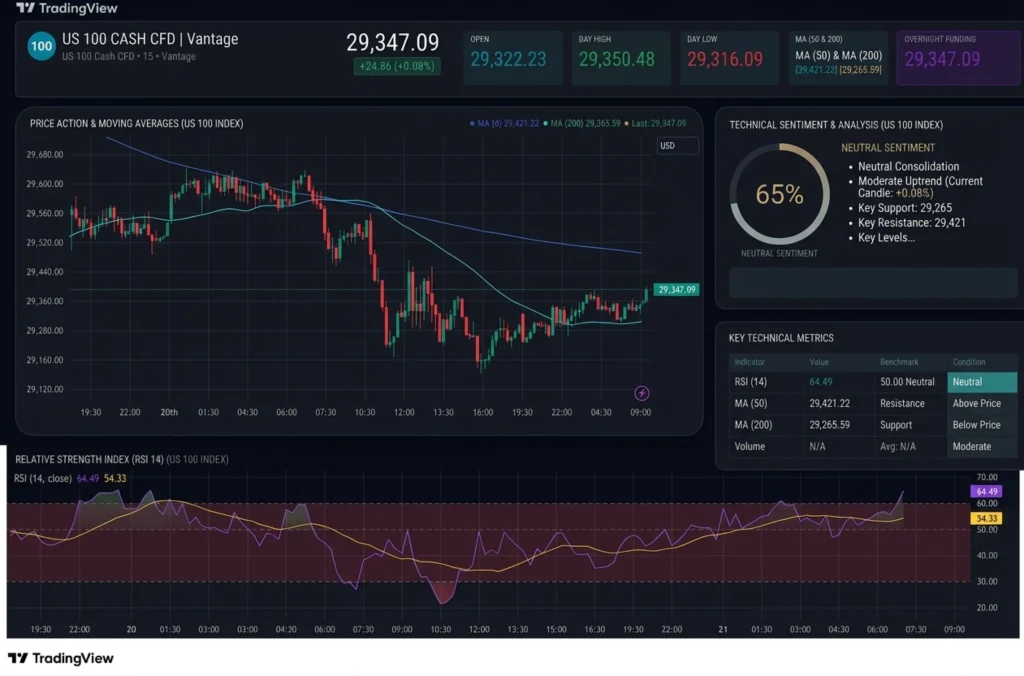
Here is the short version: the Nasdaq 100 fell hard, then clawed almost all of it back inside a day. The Vantage NAS100 CFD, tracking the index, last traded at 29,347.09, time-stamped 06:03 on the chart used for this piece, captured on 21 August 2026. Not a dramatic number alone, but it caps one of the sharper round trips the Nasdaq index chart has drawn all month.
If you pulled up the Nasdaq index today expecting a straight line, you will not find one. This piece walks through what the chart shows, what actually moved the Nasdaq stock market today, and what sits on the calendar next. Every price below is as of the chart timestamp above unless a different date is given, and charts are indicative, sourced via TradingView through the Vantage feed.
What the Nasdaq Index Chart is Showing
The Nasdaq price action over the past 36 hours reads like two sessions stitched together. The 15-minute chart shows the index opening near 29,480 late on 19 August before extending losses through the following day. RSI(14), based on the TradingView setup used for this analysis, dropped into oversold territory below 30 around midday on 20 August, when the index traded near 29,200. The index then found its actual low later that day, in the evening, dipping toward 29,150 to 29,180, based on the Vantage NAS100 feed, a roughly 300-point round trip from the prior day’s open.
That sequencing is worth pausing on: RSI was already recovering back through the mid-30s and 40s by the time the index made its marginal new low in the evening, rather than falling alongside it. A fresh price low without a matching RSI low is a mild bullish divergence, one signal traders watch for early evidence that downside momentum is fading, though a single instance is a data point, not a pattern.
By the most recent bar, RSI(14) had reached 64.49, with its signal average at 54.33, still short of overbought. The Nasdaq 100 today also sits back above its 200-period moving average, now at 29,265.59, while the 50-period average is higher at 29,421.22. That puts the index in the gap between the two, less a verdict than a recovery attempt still finding its feet.
The Story Behind Today’s Nasdaq News

The chart’s V-shape lines up with a fast-moving bond story. On 19 August, the US Treasury said it would more than double its buybacks of 10-, 20- and 30-year debt, from a $2 billion cap to at least $4 billion, sending yields sharply lower and helping US equities close higher: the S&P 500 added 0.21%, the Nasdaq composite index gained 0.16%, and the Dow rose 0.22%.3
By 20 August, that relief had mostly evaporated. The 30-year Treasury yield climbed back toward 5.25%, recouping most of the prior day’s decline, while the 10-year yield erased its own drop to close at 4.70%.4 The Nasdaq 100 index closed 20 August at 29,213.16, down 212.86 points, or 0.72%, in a session widely described as one where the Treasury-driven rally ran out of road.2 Iran-related headlines drew plenty of attention on the same day: US Treasury Secretary Scott Bessent told CNBC that Washington would pursue what he called “the greatest coordinated economic isolation” against Iran, part of a broader push that also kept a risk premium ticking along under oil and other risk assets.1
Where the Technical and Fundamental Reads Meet
Nasdaq today is calmer than the headlines from 20 August would suggest, and the bounce off that low tracks the steadier tone in yields into 21 August rather neatly. Nasdaq 100 futures were little changed to modestly higher early on 21 August, even with the wider Nasdaq composite index still on pace for a weekly decline of around 2.5%.1 Price action and the macro backdrop are, for now, telling the same story: the climb in yields paused, and the index stopped falling alongside it.
That is not proof the bigger pattern has turned. The RSI recovery from oversold levels is a real shift in short-term momentum, but whether it holds depends on the bond market’s next move, not the chart alone.
Levels to Watch, and the Bigger Event on Deck
For reference, not instruction, the 200-period average near 29,265.59 and the 50-period average near 29,421.22 are the two zones the index is currently working between, based on the Vantage NAS100 feed. The bigger item sits a week out: the Jackson Hole Economic Symposium runs from 27 to 29 August, with new Fed Chair Kevin Warsh expected to deliver his first keynote address as chair on 28 August, though the exact schedule was not yet formally published as of this writing.6,7 Minutes from the Federal Reserve‘s 28-29 July meeting were released on 19 August, and no major US data or earnings are scheduled for 21 August itself.8
Given how quickly this index has swung in both directions over two sessions, standard assumptions about intraday range may not hold up well this week. A Stop Loss placed with that swing in mind is one way traders keep exposure aligned with their own comfort level, rather than reacting to volatility after it has happened.
Leverage cuts both ways in a market moving this fast, magnifying a loss just as readily as a gain. Position sizing relative to account size is worth a second look ahead of Jackson Hole, when volatility across index CFDs, this one included, tends to wake up.
RISK WARNING: CFDs are complex financial instruments and carry a high risk of losing money rapidly due to leverage. You should ensure you fully understand the risks involved and carefully consider whether you can afford to take the high risk of losing your money before trading.
Disclaimer: The information is provided for educational purposes only and doesn’t take into account your personal objectives, financial circumstances, or needs. It does not constitute investment advice. We encourage you to seek independent advice if necessary. The information has not been prepared in accordance with legal requirements designed to promote the independence of investment research. No representation or warranty is given as to the accuracy or completeness of any information contained within. This material may contain historical or past performance figures and should not be relied on. Furthermore estimates, forward-looking statements, and forecasts cannot be guaranteed. The information on this site and the products and services offered are not intended for distribution to any person in any country or jurisdiction where such distribution or use would be contrary to local law or regulation.
References
[1] “Stock market today: Live updates – CNBC” https://www.cnbc.com/2026/08/20/stock-market-today-live-updates.html Accessed on 21 August 2026.
[2] “Stock Market Today (Aug. 20, 2026): Nasdaq, S&P 500 slip as Treasury rally fades – TheStreet” https://www.thestreet.com/stock-market-today/stock-market-today-dow-jones-sp-500-nasdaq-updates-aug-20-2026 Accessed on 21 August 2026.
[3] “Stock market news for Aug. 19, 2026 – CNBC” https://www.cnbc.com/2026/08/18/stock-market-today-live-updates.html Accessed on 21 August 2026.
[4] “Stock Market Today: Dow, S&P Live Updates for August 21 – Bloomberg” https://www.bloomberg.com/news/articles/2026-08-20/stock-market-today-dow-s-p-live-updates Accessed on 21 August 2026.
[5] “NASDAQ-100 (^NDX) Historical Data – Yahoo Finance” https://finance.yahoo.com/quote/%5ENDX/history/ Accessed on 21 August 2026.
[6] “About the Jackson Hole Economic Policy Symposium – Federal Reserve Bank of Kansas City” https://www.kansascityfed.org/research/jackson-hole-economic-symposium/about-jackson-hole-economic-symposium/ Accessed on 21 August 2026.
[7] “Jackson Hole 2026: Dates, Schedule, and Warsh’s First Speech as Fed Chair – Regards of Wall Street” https://www.regardsofwallstreet.com/news/jackson-hole-2026-dates-schedule-warsh-first-speech Accessed on 21 August 2026.
[8] “Stocks Waver Before Fed Minutes as Yields Retreat – Charles Schwab” https://www.schwab.com/learn/story/stock-market-update-open Accessed on 21 August 2026.
[9] “Nasdaq 100 (NDX) Index – Investing.com” https://www.investing.com/indices/nq-100 Accessed on 21 August 2026.