[Daily Trading]: Nikkei 225 Today, 14 August 2026 – Index Slips to 68,679 as Averages Converge
 Updated Updated Mon, 2026 August 17 07:38
![[Daily Trading]: Nikkei 225 Today, 14 August 2026 – Index Slips to 68,679 as Averages Converge](https://www.vantagemarkets.co.id/en/wp-content/uploads/sites/22/2026/08/Nikkei225-Daily-Analysis-August-14-2026.webp)
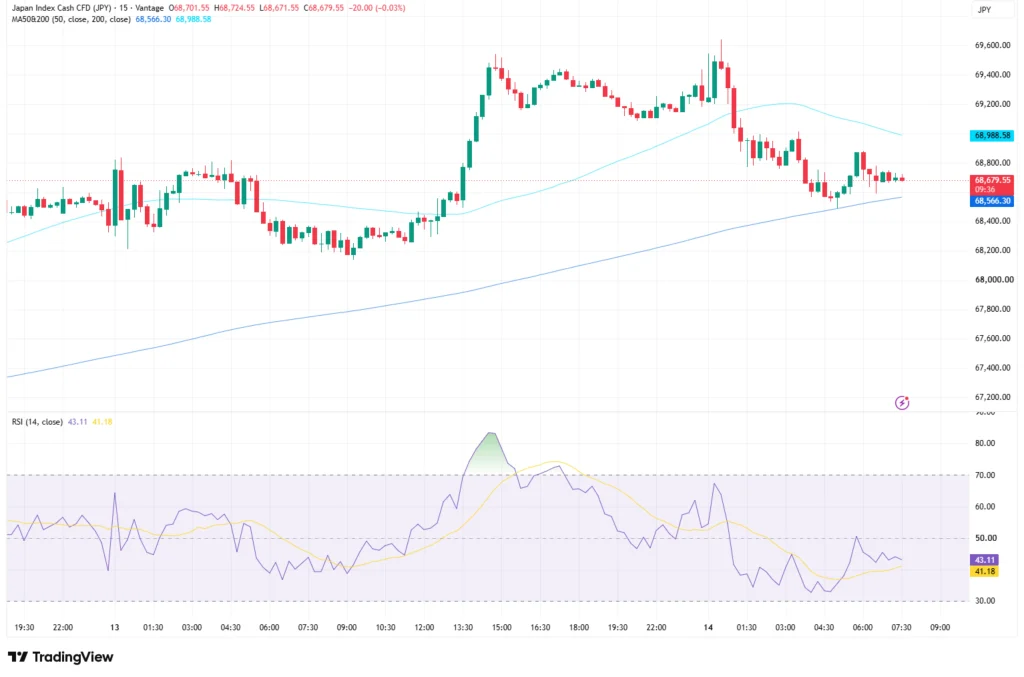
The Nikkei index today is trading at 68,679.55 as of 14 August 2026, 09:36 (GMT+2, Vantage platform time), based on the Vantage Japan Index Cash CFD (JPY) 15-minute chart, down 20 points, or 0.03%, after testing the 69,600 area twice in the past day and pulling back both times. For a Nikkei share index that spent Thursday flirting with fresh highs, Friday looks almost sleepy by comparison. This piece reads the Nikkei stock market chart and the news behind it. It does not call the next move.
Key Points
- The Nikkei225 index traded near 68,679.55 as of 09:36 (GMT+2) on 14 August 2026, cooling off after testing 69,600 twice.
- A broad Nikkei market index rally, tracking Thursday’s record close on Wall Street, pushed the Nikkei 225 index and the TOPIX to a fresh record above 4,200 points.1
- Price is now sandwiched between its 50-period average at 68,566.30 and its 200-period average at 68,988.58, and the RSI at 43.11 shows momentum cooling rather than reversing.
What The Chart Is Showing
Price action over the past day tells the story of a rally that ran out of road, twice. Wednesday evening was a non-event, boxed between 68,300 and 68,700. Thursday changed that: the Nikkei 225 index broke higher, running from around 68,650 to a session high near 69,600, then gave back roughly half of it. A second attempt at the same 69,600 ceiling early Friday met the same fate. From there, the pullback has been steady rather than dramatic, landing the index at today’s 68,679.55.
The chart’s two moving averages have effectively boxed the price in: the 50-period average sits at 68,566.30, the 200-period average at 68,988.58, and price sits between the two. The 14-period RSI reads 43.11 against its own average of 41.18, per the TradingView setup used here, both below the midline after Thursday’s brief spike above 70. Momentum has cooled; it hasn’t broken down. More on reading setups like this in Vantage’s technical analysis coverage.
The Story Behind The Move
Credit Wall Street for the setup. The S&P 500 touched an intraday high above 7,800 before closing at a record near 7,799, up around 0.65% on the day.2 The Nasdaq Composite added roughly 0.8%, and the Dow edged higher.2 A cooler-than-feared July reading on US wholesale prices, plus softer oil prices, did the heavy lifting.3
Tokyo caught the updraft. The Nikkei 225 opened firmer and briefly reclaimed 69,000 for the first time in about a month, while the TOPIX broke 4,200 points for the first time on record.1 Chip names led the Nikkei stock market rally, Advantest and Kioxia Holdings among them, while some banking stocks sat this one out.1 Strong headline, quieter follow-through, which is roughly what has played out since. Markets have mostly shrugged off the ongoing Middle East conflict, favouring earnings and the broader AI theme instead.4 That could change quickly if either story moves.
Levels To Watch
| Level | Price | What it means |
| Resistance | ~69,600 | Session high tested twice in the past day, so far unbroken |
| 200-period MA | 68,988.58 | Index has struggled to hold above this average today |
| 50-period MA | 68,566.30 | Nearest support on the 15-minute chart |
| Range floor | ~68,300 | Base of Wednesday evening’s consolidation range |
Table 1: Key levels based on the Vantage Japan Index Cash CFD 15-minute chart, TradingView. As of 14 August 2026, 09:36 (GMT+2). Indicative only.
Risk Considerations For Today’s Session
Sandwiched between two averages with RSI at a neutral 43.11, the Nikkei 225 CFD can still swing hard around the Asia-US session overlap. Worth rechecking Stop Loss placement against the 68,566 to 68,988 zone rather than trusting a fixed distance from price.
Leverage does not pick sides; it stretches gains and losses at the same rate, so position sizing should track account equity, not the size of the last 69,600 test. Anyone trading this instrument with leverage should keep that in mind, along with sound risk management, before the next data print resets the board.
What To Watch Next
Next for Nikkei news: any fresh signal from Japanese policymakers, plus the next round of US inflation data, both capable of deciding how much of Friday’s mood survives into next week. For continued Nikkei 225 today news, browse Vantage’s Nikkei225 News tag, check the Asian Markets News Today tag, or catch up on our previous Nikkei 225 analysis from 5 August. Traders can also review the full Nikkei 225 CFD trading guide or explore Vantage’s full range of index CFDs, including the S&P 500. All prices in this piece are indicative and for informational purposes only.
RISK WARNING: CFDs are complex financial instruments and carry a high risk of losing money rapidly due to leverage. You should ensure you fully understand the risks involved and carefully consider whether you can afford to take the high risk of losing your money before trading.
Disclaimer: The information is provided for educational purposes only and doesn’t take into account your personal objectives, financial circumstances, or needs. It does not constitute investment advice. We encourage you to seek independent advice if necessary. The information has not been prepared in accordance with legal requirements designed to promote the independence of investment research. No representation or warranty is given as to the accuracy or completeness of any information contained within. This material may contain historical or past performance figures and should not be relied on. Furthermore estimates, forward-looking statements, and forecasts cannot be guaranteed. The information on this site and the products and services offered are not intended for distribution to any person in any country or jurisdiction where such distribution or use would be contrary to local law or regulation.
References
[1] “Nikkei 225 Reclaims 69,000 Level for First Time in a Month; TOPIX Tops 4,200 Points for the First Time – BigGo Finance” https://finance.biggo.com/news/ed87bd32-cdc9-4ebd-acc1-ccc2b71874fa Accessed on 14 August 2026.
[2] “Stock market news for Aug. 13, 2026 – CNBC” https://www.cnbc.com/2026/08/12/stock-market-today-live-updates.html Accessed on 14 August 2026.
[3] “U.S. stocks rise to a record as oil prices drop and inflation gets less bad – Spectrum News” https://spectrumlocalnews.com/us/snplus/business/2026/08/13/stock-market-august-13-2026 Accessed on 14 August 2026.
[4] “Asian stocks set for weekly gain on fading US rate hike wagers – Reuters, via Investing.com” https://au.investing.com/news/economy-news/asian-stocks-set-for-weekly-gain-on-fading-us-rate-hike-wagers-4599485 Accessed on 14 August 2026.
[5] “Nikkei Stock Average, Nikkei 225 (NIKKEI225) – FRED, Federal Reserve Bank of St. Louis” https://fred.stlouisfed.org/series/NIKKEI225 Accessed on 14 August 2026.
[6] “Nikkei 225 Index Today (N225) – Investing.com” https://www.investing.com/indices/japan-ni225 Accessed on 14 August 2026.
[7] “Nikkei 225 (^N225) Charts, Data & News – Yahoo Finance” https://finance.yahoo.com/quote/%5EN225/ Accessed on 14 August 2026.