[DAILY TRADING] NAS100 Analysis 31 July 2026 – Nasdaq 100 Snaps Back as Big Tech Earnings Split the Room
 Updated Updated Fri, 2026 July 31 09:27
![[DAILY TRADING] NAS100 Analysis 31 July 2026 – Nasdaq 100 Snaps Back as Big Tech Earnings Split the Room](https://www.vantagemarkets.co.id/en/wp-content/uploads/sites/22/2026/07/NAS100_hero_9Jun2026-2.webp)
As of 01:24 (UTC) on 31 July 2026, the Vantage NAS100 CFD sat at 28,443.65. Although the headline price appears stable, the Nasdaq 100 experienced one of its most volatile weeks in recent months, suffering a sharp earnings- and Fed-driven pullback before rebounding strongly.
This article analyses today’s Nasdaq 100 chart and the news that built it. It translates the price action; it does not call the next move.
Key Points
- The Vantage NAS100 CFD traded near 28,443.65 as of the cut-off, back above both its 50-day and 200-day moving averages after briefly dipping under them earlier this week.
- The Federal Reserve held its benchmark rate at 3.50%‐3.75% on 29 July 2026 in a 9-3 vote, with three regional presidents dissenting in favour of a hike.
- Microsoft’s blowout earnings, released after the 29 July 2026 close, drove a sharp Nasdaq 100 rebound on 30 July 2026 even as Meta shares came under pressure over AI spending concerns.
What today’s Nasdaq 100 chart is showing
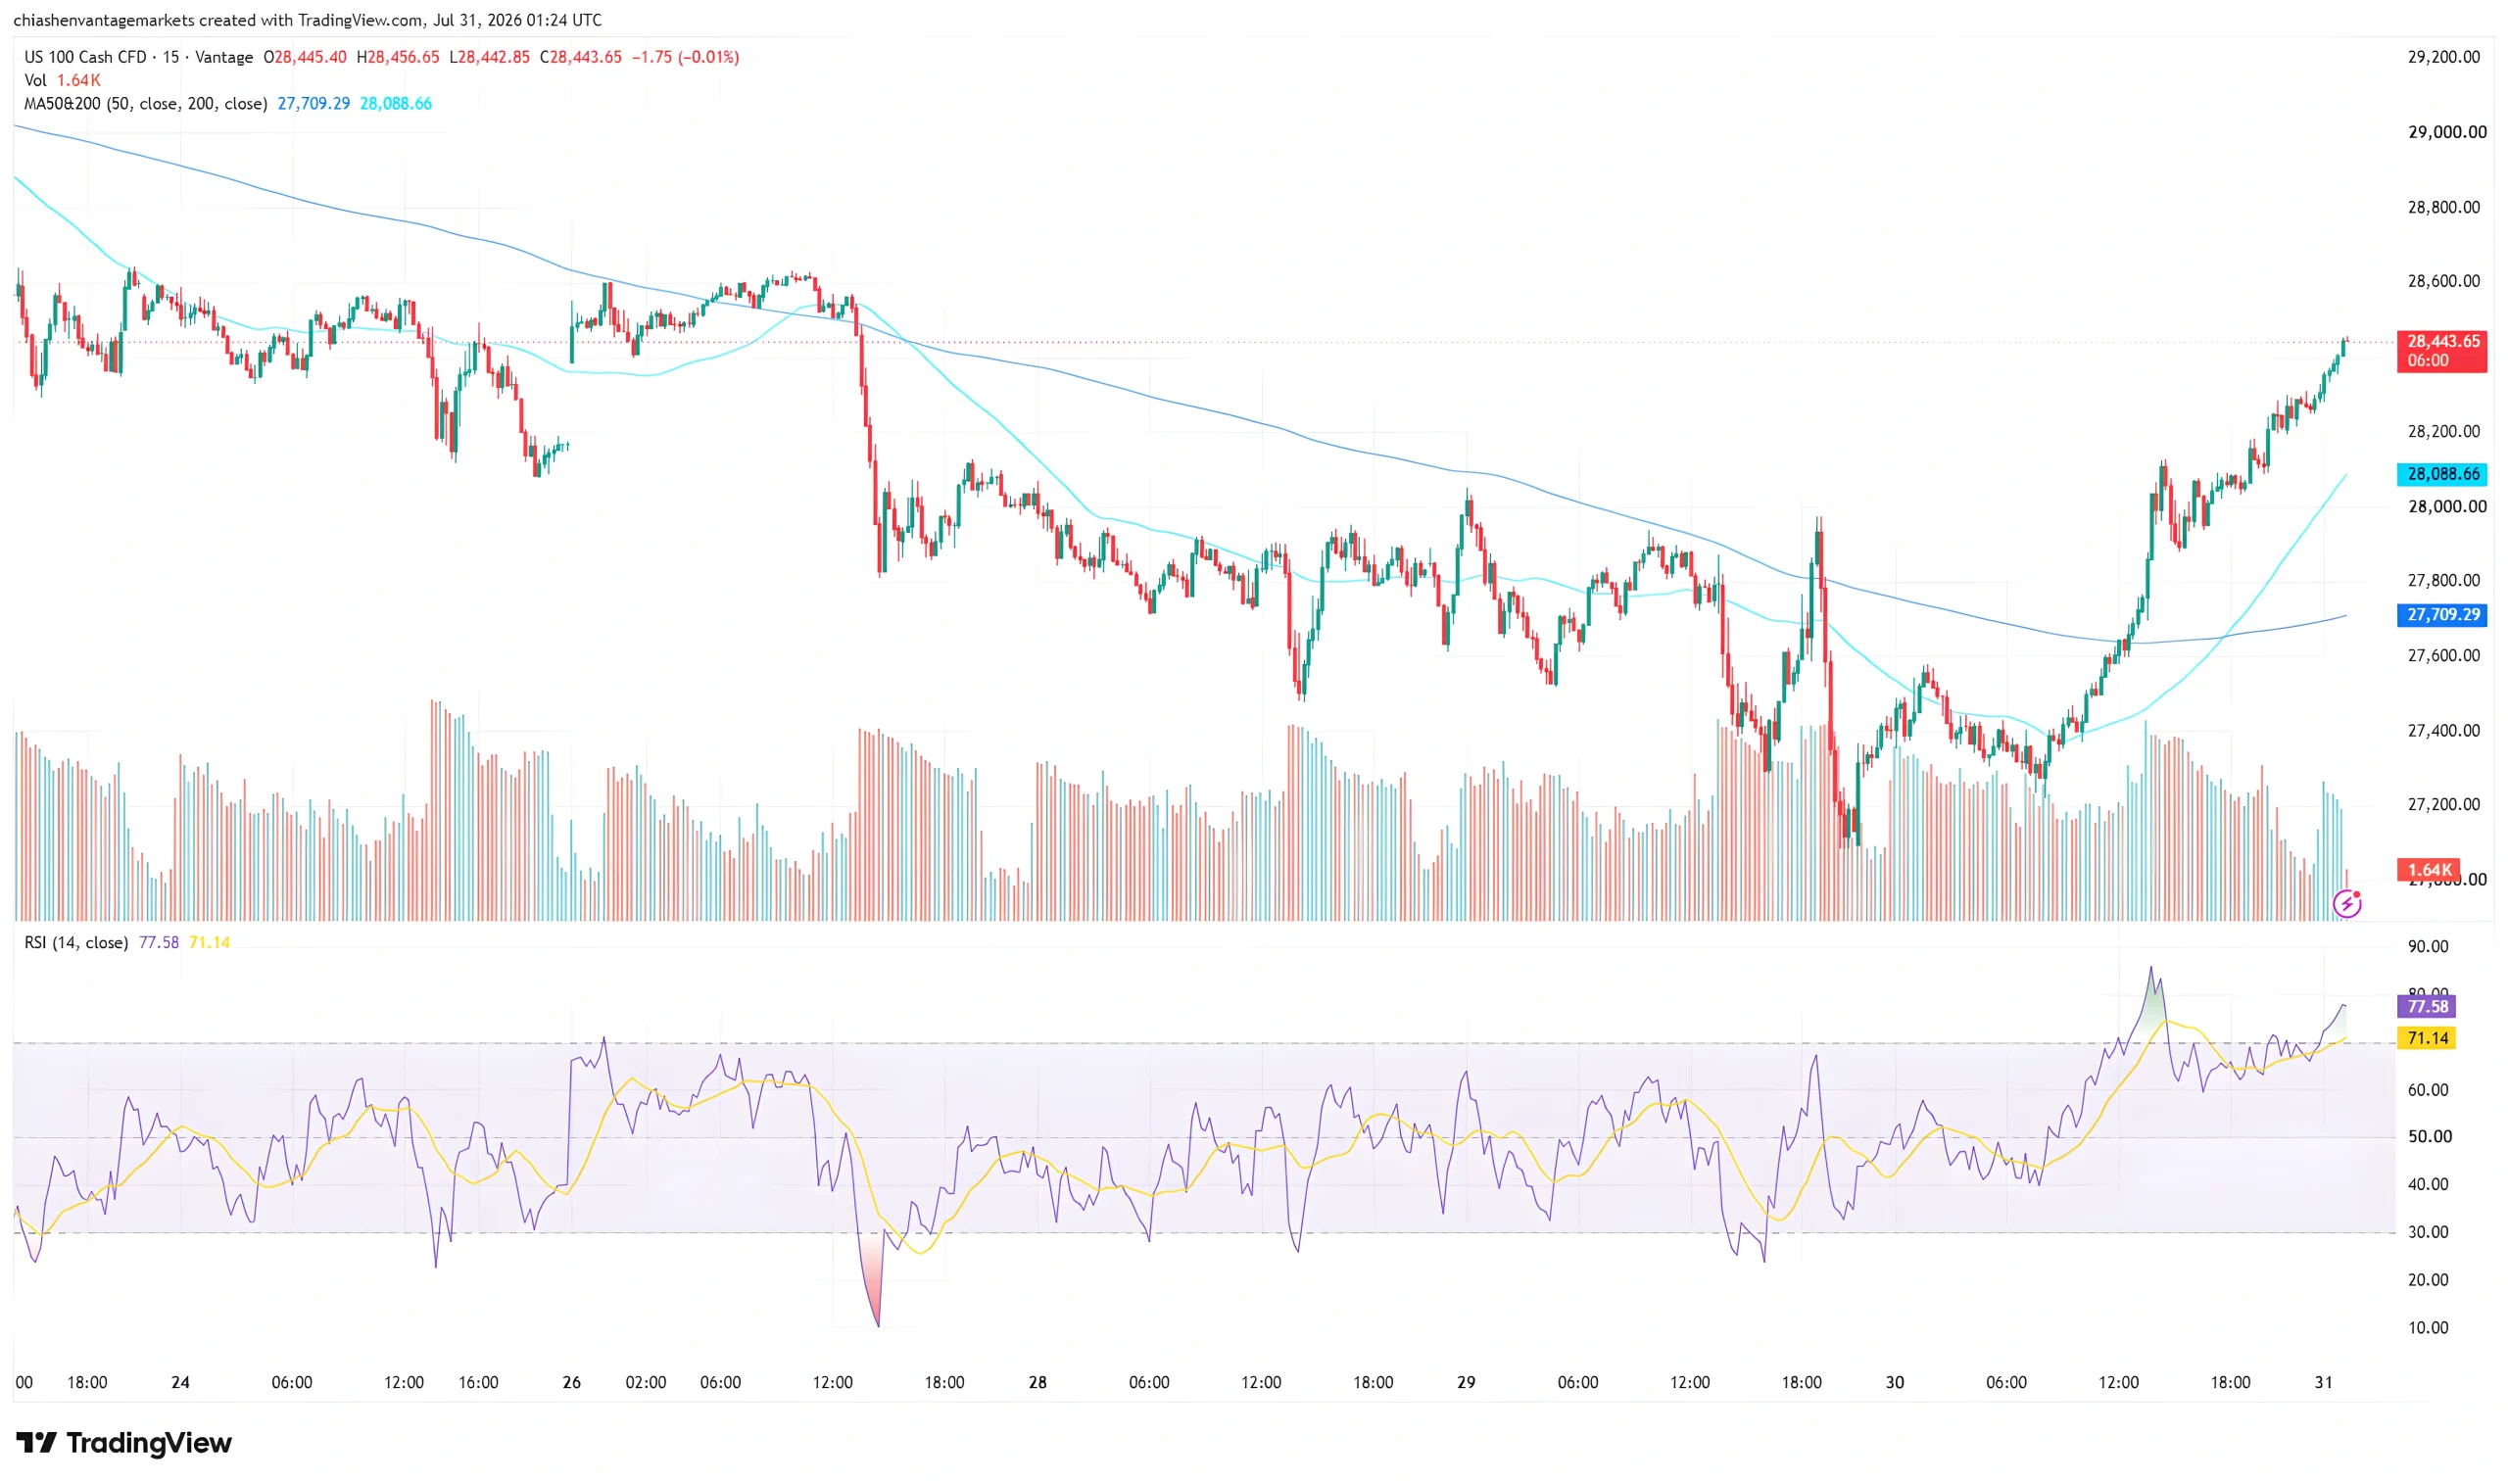
Pull up the 15-minute Nasdaq 100 chart and the story splits into three acts. A slow drift lower into 24–25 July 2026 near 28,600. A sharp break toward the 27,600–27,700 zone, deepened by the Fed’s 29 July 2026 hold, that pushed the RSI (14) on the TradingView setup used for this analysis down to roughly 10, about as oversold as this index gets. Then the comeback.
By the cut-off, the Vantage NAS100 CFD had clawed back above its 50-day moving average (27,709.29) and its 200-day moving average (28,088.66), based on the moving-average legend on the chart. The RSI (14) on the TradingView setup used for this analysis last read 77.58, with its signal average at 71.14, both above 70, indicating strong upside momentum after the rebound rather than automatically signalling an imminent reversal. Volume on the Vantage CFD feed measured 1.64K on the most recent bar.
What’s pulling the Nasdaq 100 index in two directions

An unusually divided Fed
The Federal Reserve’s rate-setting committee voted 9-3 on 29 July to hold the federal funds rate at 3.50%‐3.75%, its fifth straight meeting without a change.[1] Three regional presidents, Beth Hammack, Neel Kashkari and Lorie Logan, dissented in favour of a hike, pointing to inflation that has sat above target for years, making it one of the most divided FOMC votes in years.[2] Markets read it as a hawkish hold: longer-dated Treasury yields rose and major indices slipped in the hours afterward, before turning higher into the next session.
Earnings season cuts both ways for mega-cap tech
Microsoft’s fiscal fourth-quarter numbers, out after the 29 July close, showed revenue of $90.01 billion against estimates near $87.62 billion, with Azure’s constant-currency growth hitting 43%, well ahead of Street estimates near 40%.[3] Microsoft’s stronger-than-expected Azure growth lifted semiconductor and AI-related stocks across the Nasdaq, and the stock surged in the following session.
Meta told a different story the same evening. Shares came under pressure after investors focused on higher AI spending and cautious forward expectations despite solid underlying results.[3] A reminder that this earnings season is rewarding cloud growth and capital discipline over headline AI spending alone. Apple and Amazon reported after the 30 July close too: Apple initially traded lower despite beating revenue expectations, while Amazon gained after reporting stronger cloud growth.[4]
Levels to watch
The table below covers the zone traders are watching on the Vantage NAS100 CFD. These are reference levels, not trade signals.
| Instrument | Support | Resistance | What’s happening |
| NAS100 | 27,700 / 27,000 | 28,600 / 28,800 | Testing the pre-selloff range after a sharp two-day recovery |
Table 1: Key levels as of 31 July 2026. Source: TradingView. Data as of 31 July 2026. Indicative only.
- The 27,700 area coincides with the current 50-period moving average on the chart.
- The 28,600–28,800 zone represents the pre-selloff trading range where supply previously emerged.
- A move back below the 200-day moving average near 28,088.66 would put the index back inside the range it broke down from.
What to watch this week and beyond
- Earnings Reaction, 31 July: Whether Thursday’s earnings-led bid stretches across more Nasdaq 100 names beyond Microsoft.
- Fed Commentary, Ongoing: Further remarks from Fed officials could shift how the policy path is priced into year-end.
- US Core PCE Inflation, 31 July: Investors will watch the Fed’s preferred inflation gauge for further clues on the policy outlook.
- Middle East Conflict, Ongoing: Developments there continue to sway energy prices and broader risk sentiment.
Nasdaq 100 has covered several thousand points in either direction inside a single week, trading on both sides of its 50-day and 200-day moving averages along the way. Traders watching the Vantage NAS100 CFD often keep Stop Loss placement under closer review in stretches like this, particularly around the 27,700 and 28,600 zones above, since normal intraday range assumptions can be less reliable while earnings and Fed headlines are still working through the price.
Leverage is available on the Vantage NAS100 CFD, and like any leveraged position, it cuts both ways, amplifying gains as well as losses. Position sizing relative to overall account exposure is worth a second look ahead of further earnings and any additional Fed commentary this week.
Keep up with the Nasdaq 100
More on today’s move: NAS100 News, Nasdaq News Today, Stock Market News Today, Federal Reserve News, Earnings News Today, Indices News, and Vantage’s Nasdaq 100 guide and technical analysis coverage.
RISK WARNING: CFDs are complex financial instruments and carry a high risk of losing money rapidly due to leverage. You should ensure you fully understand the risks involved and carefully consider whether you can afford to take the high risk of losing your money before trading.
Disclaimer: The information is provided for educational purposes only and doesn’t take into account your personal objectives, financial circumstances, or needs. It does not constitute investment advice. We encourage you to seek independent advice if necessary. The information has not been prepared in accordance with legal requirements designed to promote the independence of investment research. No representation or warranty is given as to the accuracy or completeness of any information contained within. This material may contain historical or past performance figures and should not be relied on. Furthermore estimates, forward-looking statements, and forecasts cannot be guaranteed. The information on this site and the products and services offered are not intended for distribution to any person in any country or jurisdiction where such distribution or use would be contrary to local law or regulation.
References
[1] “Federal Reserve issues FOMC statement” Federal Reserve https://www.federalreserve.gov/newsevents/pressreleases/monetary20260729a.htm Accessed on 31 July 2026.
[2] “Fed rate decision July 2026: Divided Fed holds interest rates steady” CNBC https://www.cnbc.com/2026/07/29/fed-rate-decision-july-2026.html Accessed on 31 July 2026.
[3] “Stock market news for July 30, 2026” CNBC https://www.cnbc.com/2026/07/29/stock-market-today-live-updates.html Accessed on 31 July 2026.
[4] “Stocks making the biggest moves after hours: Apple, Amazon, Rivian, Reddit & more” CNBC https://www.cnbc.com/2026/07/30/stocks-making-the-biggest-moves-after-hours-aapl-amzn-rivn-rddt-.html Accessed on 31 July 2026.
[5] “NASDAQ 100 Index Chart, NDX” TradingView https://www.tradingview.com/symbols/NASDAQ-NDX/ Accessed on 31 July 2026.