[DAILY TRADING]: DJ30 Analysis 31 July 2026 – Dow Jones Today: DJ30 Catches Its Breath After Fed Whiplash
 Updated Updated Fri, 2026 July 31 09:33
![[DAILY TRADING]: DJ30 Analysis 31 July 2026 – Dow Jones Today: DJ30 Catches Its Breath After Fed Whiplash](/wp-content/themes/vantage/images/academy-post-default-img.webp)
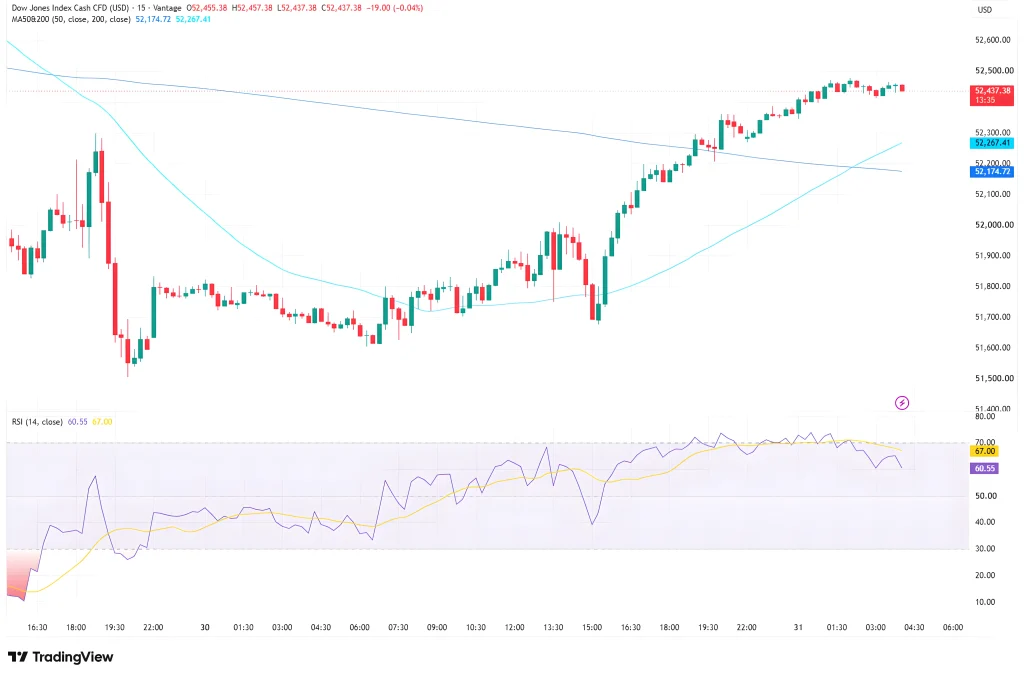
Two days ago, the Dow Jones looked like it was coming apart at the seams. Today, DJ30 is doing the opposite: sitting quietly just under its session high, almost daring the market to make the next move. The current Dow Jones index level on the Vantage DJ30 CFD chart was 52,437.38 as of 13:35 (platform time) on 31 July 2026, a stone’s throw from the 52,457.38 high printed on the same candle run. That calm follows one of the roughest, then strongest, back-to-back sessions the Dow Jones average has had all year. Here’s what today’s Dow Jones chart shows, and why the whiplash happened.
What Today’s DJ30 Chart Is Actually Showing
On the 15-minute chart, the most recent candle on the Vantage DJ30 CFD read: open 52,455.38, high 52,457.38, low 52,437.38, close 52,437.38, down 19.00 points (-0.04%). A tight, 20-point high-low range that barely counts as a wobble after the week this index has had.
Both moving averages plotted on the chart sit underneath price. The 50-period average reads 52,174.72, the 200-period reads 52,267.41, and the roughly 90-point gap between them has been shrinking fast as the shorter average plays catch-up. A convergence like this usually means one of two things is coming: a clean crossover, or a stretch of sideways chop.
The RSI backs that read. It sits at 60.55, with its own moving average at 67.00, according to the TradingView setup used for this analysis. Both are comfortably bullish, but the RSI has eased off a near-70 overbought peak reached during Thursday’s rally. That’s not the market losing conviction. It’s the market catching its breath.
Why Dow Jones Stocks Just Had Their Wildest 48 Hours in Months

Rewind to Wednesday, and Dow Jones stocks were in freefall. Kevin Warsh’s Federal Reserve, in only his second meeting as chair, voted 9-3 to hold rates at 3.50% to 3.75%, with three regional presidents, Beth Hammack, Neel Kashkari and Lorie Logan, dissenting in favour of a hike.1 That’s the most one-sided dissent the Committee has logged since September 2016, and Wall Street didn’t need much convincing on what it meant.2
Long-dated Treasury yields spiked, and the Dow Jones Industrial Average dropped 1,153.18 points, or 2.19%, to close at 51,594.14, its worst single day since April 2025.3 The Middle East conflict was named alongside the Fed decision as another reason inflation looked stubborn that week.4 Warsh himself was blunt about it, saying the central bank has “no tolerance for persistently elevated inflation”.5
Then Thursday flipped the script. Microsoft surged 16% after Azure revenue crossed $100 billion for fiscal 2026 for the first time, adding roughly $450 billion in market value and dragging the rest of the market up with it.6 The Dow rose 613.92 points, or 1.19%, to close at 52,208.06, riding the same rebound in beaten-down chip and tech names.7 Friday’s Asia session carried that improved mood into index futures too, even if DJ30 itself has settled into more of a pause than a continuation.
What’s Actually Moving Today’s Dow Jones Index
Today’s Dow Jones index mood is the same one that lifted Wall Street on Thursday: Asia-Pacific futures pushed higher after strong US tech earnings.6 DJ30 is a different animal to the Nasdaq, though. Its industrial and financial-heavy makeup means it answers more to Treasury yields and oil prices than to chipmakers, which is likely why it has clawed back a smaller share of Wednesday’s damage than the broader market.
The economic backdrop hasn’t gone away either. Second-quarter GDP grew at just 1.5%, below the 1.8% economists expected, while core inflation held at an annual 3.3%.7 Soft growth and sticky inflation sitting side by side is exactly the combination keeping long-end yields, and rate expectations, in the spotlight heading into next week.
Dow Jones Levels to Watch, and the Risk Side of the Story
The two moving averages, 52,174.72 and 52,267.41, are the nearest support zone below current price now that they’re trading closer together than they have in a while. Above the market, 52,457.38 is the immediate resistance, with the 52,600 to 52,742 zone that capped the index’s record high in late June the next real test if buyers push further.8
| Pair | Support | Resistance | What’s Happening |
| DJ30 | 52,174.72 (MA50) / 52,267.41 (MA200) | 52,457.38 (session high) / 52,600-52,742 (late-June record zone) | Consolidating after a two-day round trip; RSI easing back from near-overbought |
Table 1: DJ30 reference levels as of 13:35 (platform time), 31 July 2026. Source: Vantage DJ30 CFD chart, TradingView. Indicative only.
Leverage on DJ30 CFDs varies by account type and region, and it doesn’t pick sides. It magnifies whatever direction the trade goes, gains or losses, equally.
On exposure: with the moving averages sitting this close to price and to each other, this is a sensible moment to revisit Stop Loss placement. A Stop Loss doesn’t prevent a loss; it limits one to a size decided in advance, which matters more than usual while the index works off a move this size.
On sizing: position sizing deserves the same five minutes of attention as the Stop Loss itself. Whatever leverage is applied, position size, not just direction, decides how much the next swing costs or pays. Worth checking before the New York open.
For more Dow Jones news, Federal Reserve coverage, and the rest of Wall Street, see our Stock Market News Today hub and today’s SP500 analysis.
RISK WARNING: CFDs are complex financial instruments and carry a high risk of losing money rapidly due to leverage. You should ensure you fully understand the risks involved and carefully consider whether you can afford to take the high risk of losing your money before trading.
Disclaimer: The information is provided for educational purposes only and doesn’t take into account your personal objectives, financial circumstances, or needs. It does not constitute investment advice. We encourage you to seek independent advice if necessary. The information has not been prepared in accordance with legal requirements designed to promote the independence of investment research. No representation or warranty is given as to the accuracy or completeness of any information contained within. This material may contain historical or past performance figures and should not be relied on. Furthermore estimates, forward-looking statements, and forecasts cannot be guaranteed. The information on this site and the products and services offered are not intended for distribution to any person in any country or jurisdiction where such distribution or use would be contrary to local law or regulation.
References
1. “Fed Holds Rates Steady as Three Officials Dissent in Favor of a Hike – Bloomberg” https://www.bloomberg.com/news/articles/2026-07-29/fed-holds-rates-steady-three-officials-dissent-favoring-a-hike Accessed on 31 July 2026.
2. “Two Key Takeaways From the Fed’s Unusually Unpredictable Meeting – CNN Business” https://www.cnn.com/2026/07/29/economy/fed-rate-decision-july Accessed on 31 July 2026.
3. “Fed Holds Interest Rates Steady After Cliffhanger Meeting, but Three Officials Dissent – CNN Business” https://www.cnn.com/2026/07/29/business/live-news/federal-reserve-interest-rate-07-29-26 Accessed on 31 July 2026.
4. “Fed Rate Decision July 2026: Divided Fed Holds Interest Rates Steady – CNBC” https://www.cnbc.com/2026/07/29/fed-rate-decision-july-2026.html Accessed on 31 July 2026.
5. “Kevin Warsh’s Fed Holds Interest Rates Steady Again, but Dissent Among Officials Mounts – Forbes” https://www.forbes.com/sites/tylerroush/2026/07/29/fed-keeps-interest-rates-unchanged-as-dissent-mounts/ Accessed on 31 July 2026.
6. “Stock Market Today: Dow, S&P Live Updates for July 31 – Bloomberg” https://www.bloomberg.com/news/articles/2026-07-30/stock-market-today-dow-s-p-live-updates Accessed on 31 July 2026.
7. “Stock Market News for July 30, 2026 – CNBC” https://www.cnbc.com/2026/07/29/stock-market-today-live-updates.html Accessed on 31 July 2026.
8. “Dow Closes Little Changed After Touching Record; Nasdaq Slides to Start July – CNBC” https://www.cnbc.com/2026/06/30/stock-market-today-live-updates.html Accessed on 31 July 2026.