[DAILY TRADING]: XAUUSD Analysis 19 August 2026 — Gold Rebounds to $4,357 as Yields Ease, Fed Minutes Loom
 Updated Updated Wed, 2026 August 19 09:00
![[DAILY TRADING]: XAUUSD Analysis 19 August 2026 — Gold Rebounds to $4,357 as Yields Ease, Fed Minutes Loom](https://www.vantagemarkets.co.id/en/wp-content/uploads/sites/22/2026/08/XAUUSD-Daily-Analysis-August-19-2026.webp)
Gold just lived through a wild stretch that would make any trader reach for a second coffee. The XAUUSD price sits at $4,357.05 as of 19 August 2026, 11:29 (GMT+8), per the XAUUSD TradingView setup used for this analysis, up $2.50 (+0.06%) on the latest 15-minute candle after opening at $4,354.54 in a $4,351.91 to $4,357.90 range. 1
That calm looks almost polite next to what came before it: gold prices tumbled from an intraday high near $4,435, set in the early hours of 18 August 2026, to a low near $4,325 around midnight into 19 August, a slide of roughly $111, or about 2.5%, before finding their footing. 1 The gold price today is really the story of that recovery. We read the chart. We do not call the trade.
What the XAUUSD Chart Is Showing
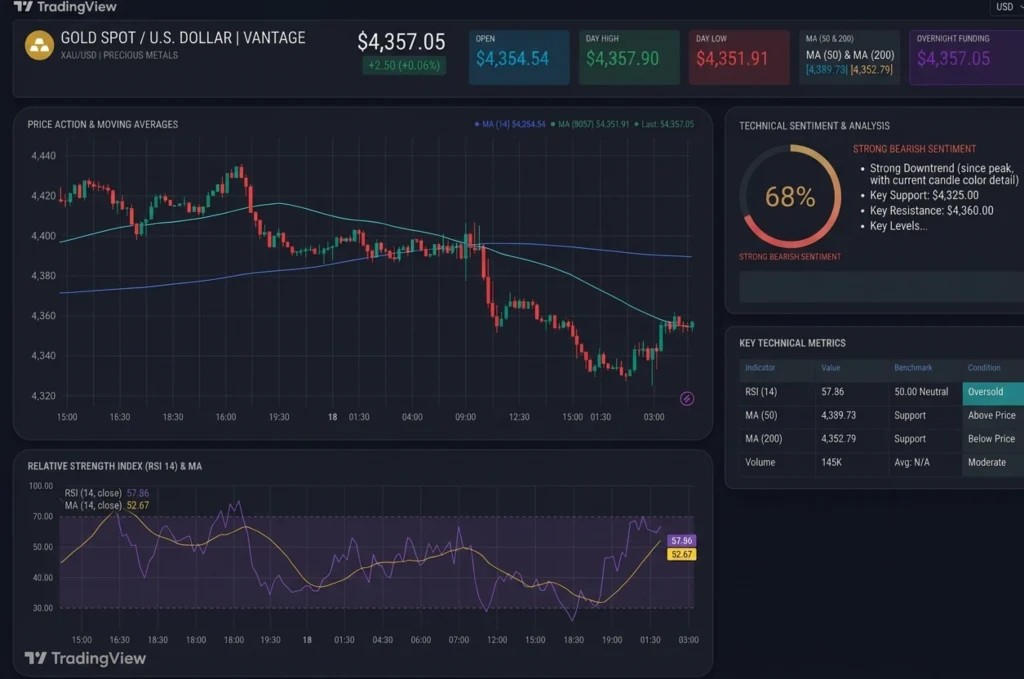
This XAUUSD technical analysis starts on the 15-minute XAUUSD chart, where the 50-period moving average sits at $4,389.73 and the 200-period average at $4,352.79, both per the TradingView setup used for this piece. Price has just clawed its way back above the 200-period line after the sharp slide earlier this week, but it remains boxed in beneath the 50-period average, which sits roughly $33 higher and lines up with the shelf gold built through 18 August before the drop.
The Relative Strength Index reads 57.86 against a 52.67 signal average, both a touch above neutral but nowhere near overbought, a market shaking off an oversold scare rather than running hot.
The sell-off itself deserves its own line: gold shed close to $111, or about 2.5%, from Tuesday’s high to the low near midnight in well under 24 hours. The bounce back has told a different story, a slow grind higher over several hours rather than one dramatic candle, usually a sign of buyers easing back in rather than a single headline flipping the script.
Why Gold Prices Pulled Back This Week
Blame the bond market first. The 30-year Treasury yield touched a fresh 19-year high near 5.32% on 18 August 2026, before easing back, as worries over government borrowing and inflation ran through the market. 2,3 Higher long-end yields make a non-yielding asset like gold less attractive to hold.
Oil then piled on. Reporting on 18 August said President Trump stated no talks were taking place or scheduled with Iran, even as Tehran maintained the Strait of Hormuz remained closed, contradicting Trump’s own claim that it was open. 4 That kind of contested, unresolved standoff keeps an energy-security premium in oil, which feeds inflation expectations and loops back into the same yield story working against gold.
Here is the twist: fading bets on a September Federal Reserve rate hike have kept a floor under bullion the whole time. Markets no longer fully price a rate increase by year-end, a shift from where things stood a week earlier, following a softer run of US data. 7,8 Higher yields pulling one way, a more patient Fed pulling the other; that tug of war is a fair description of why gold fell hard, then stopped falling.
What Is Next on the Calendar
Minutes from the Federal Reserve’s July meeting are due Wednesday, 19 August 2026, and traders will comb through them for how divided policymakers actually were on growth versus inflation. 5 After that, the Jackson Hole Economic Symposium runs from 27 to 29 August 2026, and Fed Chair Kevin Warsh’s remarks there, his first as chair, look like the bigger event for gold this month, since his tone on policy tends to move bullion more than any single data print. 6 Smaller releases due this week, weekly jobless claims and preliminary August activity data among them, add extra texture to how Federal Reserve policy pricing shifts into that window.
Levels to Watch and Risk Framing
With price parked between its 200-period average at $4,352.79 and its 50-period average at $4,389.73, those two lines are the near-term references worth watching on this chart, alongside the $4,325 area marking this week’s low and the $4,400 psychological round number just above the 50-period line. These are levels to watch, not levels to act on.
| Level Type | Price | What It Means Right Now |
| Psychological Resistance | $4,400 | Round-number reference just above the 50-period average |
| 50-Period Moving Average | $4,389.73 | Capping the recovery so far, per the TradingView setup used |
| 200-Period Moving Average | $4,352.79 | Reclaimed after this week’s slide; nearest support reference |
| Session Low (18-19 August) | $4,325 | This week’s low before the bounce began |
Table 1: XAUUSD reference levels as of 19 August 2026, 11:29 (GMT+8). Source: TradingView setup used for this analysis. Indicative only.
Gold traded as a Vantage XAUUSD CFD has covered close to $111 in well under 24 hours this week, and that pace is exactly why a Stop Loss remains one of the simplest ways to define an acceptable level of exposure ahead of the FOMC minutes and Jackson Hole, rather than after the volatility has already landed.
Leverage on a Vantage XAUUSD CFD runs up to 1:1000 and cuts both ways: it scales gains up just as easily as it scales losses, so position sizing deserves as much attention as the chart itself, especially with two catalysts still ahead this month. Readers new to the metal can find the mechanics in Vantage’s gold trading guide, and the gold news and gold price news tags track the day-to-day moves if you want to keep following this story. Safe haven assets, technical analysis, and Federal Reserve news round out the wider picture behind this XAUUSD news.
RISK WARNING: CFDs are complex financial instruments and carry a high risk of losing money rapidly due to leverage. You should ensure you fully understand the risks involved and carefully consider whether you can afford to take the high risk of losing your money before trading.
Disclaimer: The information is provided for educational purposes only and doesn’t take into account your personal objectives, financial circumstances, or needs. It does not constitute investment advice. We encourage you to seek independent advice if necessary. The information has not been prepared in accordance with legal requirements designed to promote the independence of investment research. No representation or warranty is given as to the accuracy or completeness of any information contained within. This material may contain historical or past performance figures and should not be relied on. Furthermore estimates, forward-looking statements, and forecasts cannot be guaranteed. The information on this site and the products and services offered are not intended for distribution to any person in any country or jurisdiction where such distribution or use would be contrary to local law or regulation.
References
[1] “Gold Holds Decline on Bond Jitters – Trading Economics” https://tradingeconomics.com/commodity/gold/news/576262 Accessed on 19 August 2026.
[2] “30-Year Treasury Yield Tops 5.33%, New 19-Year High, on Inflation and Spending Concerns – CNBC” https://www.cnbc.com/2026/08/18/treasury-yields-.html Accessed on 19 August 2026.
[3] “The 30-Year Treasury Hits a 19-Year High. Here’s What Is Spooking the Bond Market – 24/7 Wall St” https://247wallst.com/investing/2026/08/18/the-30-year-treasury-hits-a-19-year-high-heres-what-is-spooking-the-bond-market/ Accessed on 19 August 2026.
[4] “Trump Says No Talks Planned With Iran Amid Anger Over Iran-Oman Hormuz Deal – Al Jazeera” https://www.aljazeera.com/news/2026/8/18/no-talks-with-iran-says-trump-as-us-president-stews-over-hormuz-deal Accessed on 19 August 2026.
[5] “Meeting Calendars and Information – Board of Governors of the Federal Reserve System” https://www.federalreserve.gov/monetarypolicy/fomccalendars.htm Accessed on 19 August 2026.
[6] “EUR/USD Hits 2-Month High Before Fed Minutes and Warsh’s Jackson Hole Debut – Investing.com” https://www.investing.com/analysis/eurusd-hits-2month-high-before-fed-minutes-and-warshs-jackson-hole-debut-200685918 Accessed on 19 August 2026.
[7] “Gold Eases in Broad Metals Retreat – Trading Economics” https://tradingeconomics.com/commodity/gold/news/575984 Accessed on 19 August 2026.
[8] “CME FedWatch Tool – CME Group” https://www.cmegroup.com/markets/interest-rates/cme-fedwatch-tool.html Accessed on 19 August 2026.