[DAILY TRADING]: XAUUSD Analysis 10 August 2026: Gold Price Today Cools as the NFP Shock Fades
 Updated Updated Mon, 2026 August 10 06:10
![[DAILY TRADING]: XAUUSD Analysis 10 August 2026: Gold Price Today Cools as the NFP Shock Fades](https://www.vantagemarkets.co.id/en/wp-content/uploads/sites/22/2026/07/XAUUSD_banner_900x430_optimized-3-1.webp)
Gold had quite the Friday. As of 04:22 (GMT+8) on Monday, 10 August 2026, the Vantage XAUUSD CFD trades at $4,324.74, up 0.11% on the session, still holding onto most of last week’s sharp jump. The gold price today is busy digesting that move, and the XAUUSD chart tells the story more honestly than any headline. Here is what the 15-minute setup, the RSI, and this week’s calendar are actually saying. We read the chart; we do not call it.
What the XAUUSD Chart Is Showing
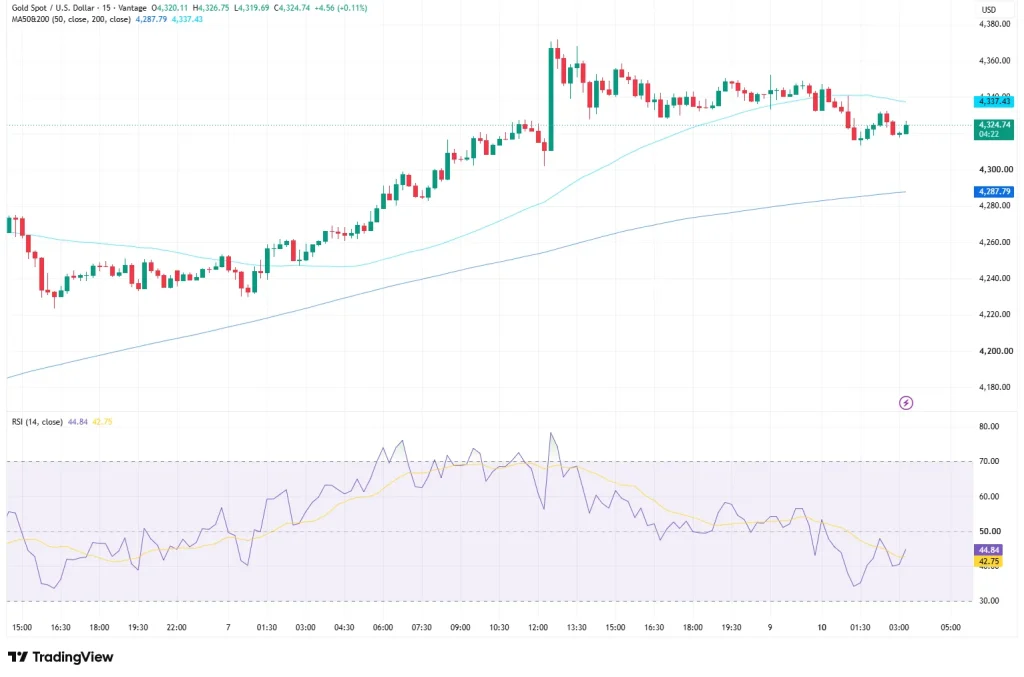
The story splits neatly in two. On Friday, 7 August, a single 15-minute candle sent gold rocketing from around $4,300 into the $4,360 to $4,380 zone, the kind of move that makes even seasoned chart-watchers sit up1 Since then, XAUUSD has spent the weekend and Monday’s Asian session handing some of that spike back, settling into a tighter band between roughly $4,315 and $4,330.
The moving averages fill in the rest. The 50-period average on the close sits at $4,287.79, climbing steadily beneath price since early August. The 200-period average sits higher at $4,337.43, just above where gold trades now. In short, this XAUUSD technical analysis shows price squeezed between a rising short-term floor and a flatter longer-term ceiling, which usually means digestion after a fast move, not the start of a new one.
RSI Signals a Cooling Trend
Momentum backs up the pullback story, though not in a straight line. The Relative Strength Index (RSI) on the 14-period setting reads 44.84, with its moving average at 42.75, per the TradingView setup used for this analysis. During Friday’s rally, RSI pushed above 70 twice, textbook overbought readings. It has cooled unevenly since: RSI dipped below 50 by Friday evening, firmed briefly over the weekend, then fell into the high-30s just after Monday’s open before steadying near current levels. At 44.84, just above its own moving average, the gauge remains below the midline but off its Monday low.
The Gold News Behind the Move

In XAUUSD news terms, Friday’s fireworks trace back to one number. US nonfarm payrolls fell by 23,000 in July, a startling miss against the roughly 83,000 gain economists had expected, while June’s figure was revised down to just 20,000.2 Unemployment ticked lower to 4.1%, though that owed more to shrinking labour force participation than to stronger hiring.2
The US Dollar Index promptly slid to a multi-week low and the 10-year Treasury yield fell as traders scaled back bets on a near-term Federal Reserve rate move, and gold caught the tailwind.3,6 Easing concerns tied to the Middle East conflict added further support to the wider risk repricing seen across markets last week.4
Now the calendar takes over. US CPI for July is due Wednesday, 12 August, followed by PPI and weekly jobless claims on Thursday.7 Both prints will be read for confirmation of the disinflation story markets are currently pricing, with CME Group’s FedWatch tool likely doing a lot of the talking in between.5
XAUUSD Levels to Watch and Risk Considerations
These are the levels currently in view on the Vantage XAUUSD CFD chart, worth watching, not worth trading off blindly.
| Level Type | Price (USD) | What’s Happening |
| Support | 4,287.79 | 50-period moving average on the close |
| Support | 4,300.00 | Round-number level inside the recent consolidation |
| Resistance | 4,337.43 | 200-period moving average on the close |
| Resistance | 4,360 – 4,380 | Zone of Friday’s post-NFP session high |
Table 1: Key XAUUSD levels observed on the Vantage XAUUSD CFD chart as of 04:22 (GMT+8), 10 August 2026. Source: TradingView setup used for this analysis. Accessed on 10 August 2026.
Leverage on gold CFDs remains a double-edged tool. It magnifies a loss just as readily as a gain, whichever side of this range price lands on.
Given how fast gold moved from Friday’s spike into today’s tighter band, Stop Loss placement relative to the 50- and 200-period averages is worth a second look rather than leaning on assumptions from a quieter week. Anyone holding correlated exposure across gold, the US Dollar Index, and other Middle East-sensitive assets should keep an eye on the combined picture heading into Wednesday’s inflation data.
Leverage magnifies both potential returns and potential losses, and this swing is a fair reminder of how fast that exposure can move. Position sizing relative to account equity is worth reviewing ahead of the 12 August CPI print, particularly for anyone carrying leveraged positions into the release.
RISK WARNING: CFDs are complex financial instruments and carry a high risk of losing money rapidly due to leverage. You should ensure you fully understand the risks involved and carefully consider whether you can afford to take the high risk of losing your money before trading.
Disclaimer: The information is provided for educational purposes only and doesn’t take into account your personal objectives, financial circumstances, or needs. It does not constitute investment advice. We encourage you to seek independent advice if necessary. The information has not been prepared in accordance with legal requirements designed to promote the independence of investment research. No representation or warranty is given as to the accuracy or completeness of any information contained within. This material may contain historical or past performance figures and should not be relied on. Furthermore estimates, forward-looking statements, and forecasts cannot be guaranteed. The information on this site and the products and services offered are not intended for distribution to any person in any country or jurisdiction where such distribution or use would be contrary to local law or regulation.
References
[1] “Gold heads for best week since January as U.S. jobs data in focus – CNBC” https://www.cnbc.com/amp/2026/08/07/gold-heads-for-best-week-since-january-us-jobs-data-in-focus.html Accessed on 10 August 2026.
[2] “Jobs report July 2026 – CNBC” https://www.cnbc.com/2026/08/07/jobs-report-july-2026.html Accessed on 10 August 2026.
[3] “United States Dollar Index – Trading Economics” https://tradingeconomics.com/united-states/currency Accessed on 10 August 2026.
[4] “United States Dollar Index rebounds following Israeli airstrike, Jobless Claims eyed – FXStreet” https://www.fxstreet.com/news/united-states-dollar-index-rebounds-following-israeli-airstrike-in-southern-lebanon-202608060855 Accessed on 10 August 2026.
[5] “CME FedWatch Tool – CME Group” https://www.cmegroup.com/markets/interest-rates/cme-fedwatch-tool.html Accessed on 10 August 2026.
[6] “Treasury yields drop after surprise jobs loss in July – CNBC” https://www.cnbc.com/2026/08/07/treasury-yields-steady-ahead-of-key-nonfarm-payrolls-jobless-data.html Accessed on 10 August 2026.
[7] “CPI Home – U.S. Bureau of Labor Statistics” https://www.bls.gov/cpi/ Accessed on 10 August 2026.