Oil choppy, stocks mixed awaiting Hormuz deal

Jamie Dutta >
Jamie Dutta >
Jamie Dutta is a Market Analyst for Vantage. He comes with extensive experience as a full-time trader and financial market commentator, having worked as a trader in top tier investment banks and trading houses.
 Updated Thu, 2026 August 6 04:16

- Iran and Oman negotiators finalise draft Strait of Hormuz deal
- Gold scales one-peak as US-Iran peace hopes ease inflation worries
- AMD shares slide after AI growth outlook underwhelms investors
- Microsoft’s AI sales come mostly from OpenAI, disclosures show
Forex
USD slid for a second day on high optimism for a ceasefire Hormuz deal. Two major data releases also came in softer than expected. ADP jobs printed at 44k against expectations of 70k while ISM Services for July printed at 54.1 versus the 54.5 estimate. Other US employment data suggest that the labour market is tight but not necessarily adding to inflation pressure at the moment. Treasury yields moved very modestly lower with the odds of a September rate hike now a near coin toss at 55%. This was virtually fully priced in before the most recent FOMC meeting.
EUR outperformed most of its peers as the major tested the week’s high and levels last seen in mid-June. Interest rate differentials are mildly positive for the euro with bulls targeting the 100-day SMA above at 1.1568, and the 200-day at 1.1627. This comes after last week’s better than expected eurozone data and falling energy prices also helping underpin support.
GBP was mid-pack versus its peers with modest gains against the greenback. A media report overnight suggested the government would look to exploit a Reeves-era fiscal rules loophole to increase government borrowing by as much as £9bn. However, a factor soothing markets is perhaps how both PM Burnham and new Chancellor Healey have previously expressed willingness to utilise flexibility in the fiscal rules.
JPY steadied with a tiny range day compared to the previous few sessions of massive intervention. US Treasury Secretary Bessent provided some colour on the recent participation in joint yen intervention. He said that yen weakness could trigger competitive devaluations in the region, which previously have been blamed for the hollowing out of the US manufacturing sector. Potentially too there may have been some understanding that the BoJ would hike earlier than expected in September. Chances of this happening have been marked sharply higher this week.
NZD underperformed amid the unemployment rate unexpectedly moving higher to 5.6% in Q2, two-tenths higher than the 5.4% estimate, and above the prior 5.3%. This was despite better-than-expected employment growth, 0.5% Q/Q, versus an expected 0.1%, and previous 0.2%. The initial move lower retraced through the day, with the week’s high at 0.5908 nearby.
Stocks
US stocks: The S&P 500 lost 0.17% to close at 7,723, the Nasdaq closed down 0.83% at 29,488 and the Dow Jones settled higher by 0.49% at 5`4,354, another fresh all-time high. Sector performance was mixed with Materials and Health care outperforming while Communication Services and Energy were the major laggards. Google declined 4% on reports of further senior people leaving, this time the chief scientist. Market breadth was slightly negative, with the equal-weight S&P 500 (RSP) edging lower. SpaceX dropped 13% as the Elon Musk company touted faster than forecast AI returns on its first ever earnings call as a public company, with concerns about Starlink being able to bankroll costly capex. Eli Lilly jumped over 4% after its results, as it beat estimates on resilient demand for injectable GLP-1 drugs, further widening the gap with its major competitor Novo Nordisk. Chipmaker AMD fell more than 6% as results that beat analysts’ estimates failed to meet investor’s lofty expectations.
Asian Stocks: Futures are mixed. APAC stocks were mostly higher with gains following the record closes on Wall Street. The ASX 200 traded higher with tech and miners strong but weakness in energy and financials. The Nikkei 225 moved back above 66,000 with Softbank jumping double digits. The Hang Seng and Shanghai Comp were mixed with the mainland relatively upbeat but Hong Kong flat amid energy softness.
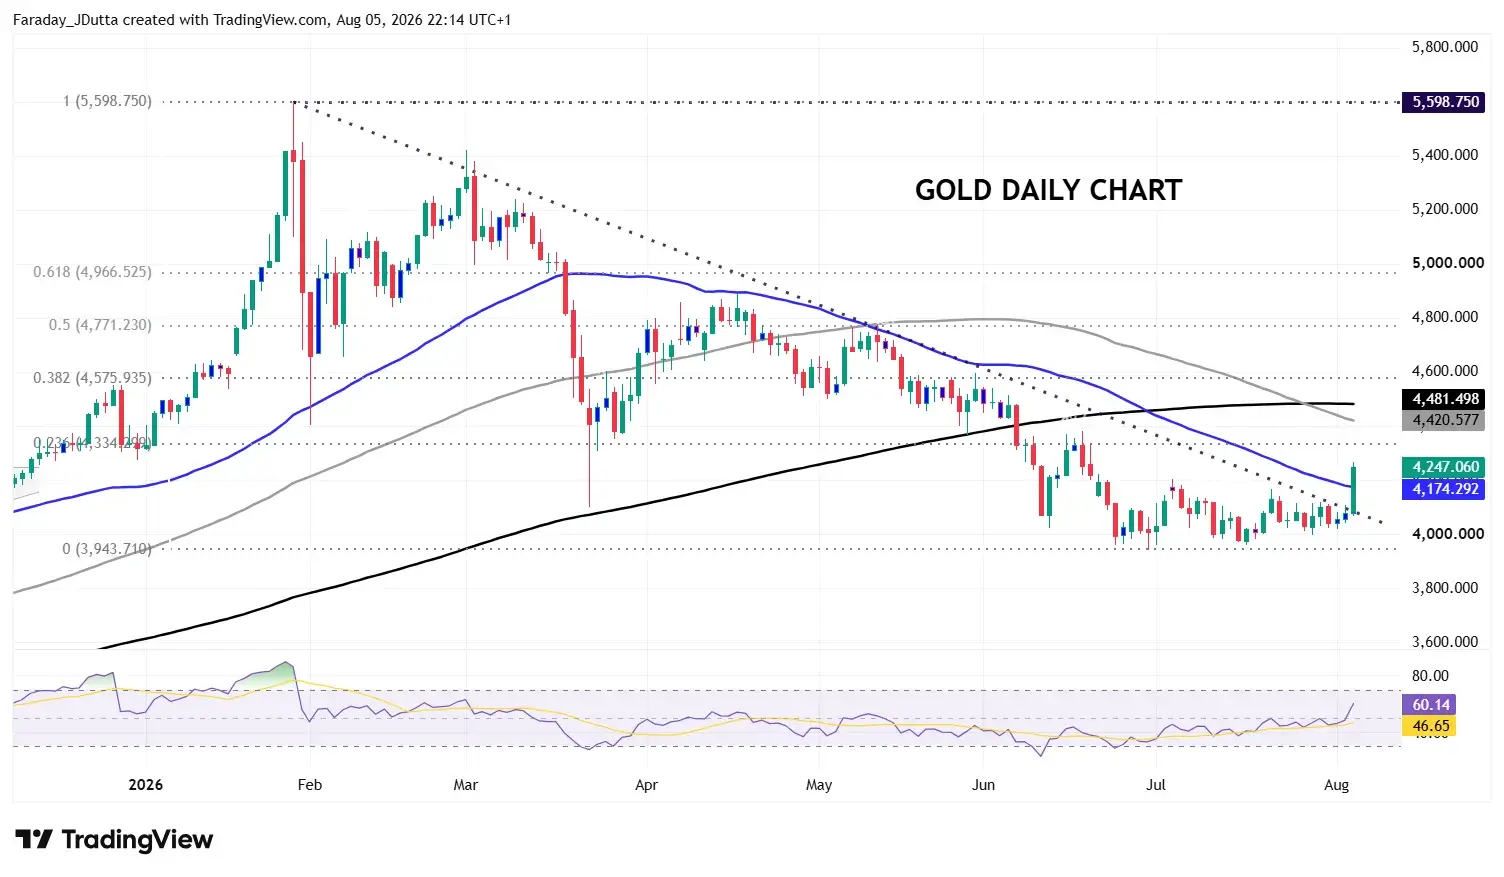
Gold finally surged higher, bursting through the 50-day SMA at $4,174 with a strong 4.4% break to the upside. Please see below for more.
Chart of the Day – Gold upside breakout
Bullion enjoyed its biggest intra-day gain since the end of January and the day before the historic spike top at $5,598. Bugs lifted prices to a six-week high last seen in mid-June. As we have said for some time, the longer prices track sideways, the bigger the range expansion and breakout typically will be. Sliding oil and energy prices have seen inflation worries ease, on the back of hopes for the reopening of the Strait of Hormuz.
This has seen Treasury yields fall and encouraged buyers, as bets on Fed policy tightening have been pared back. There’s now near a coin flip chance of a September rate hike, which was fully priced just a few weeks ago. Also underpinning support for prices is ongoing central bank buying, with Poland a big buyer and China extending its buying streak to 20 months, according to recent World Gold Council figures. Prices closed above the 50-day SMA at $4,174 for the first time since March and closed above the falling trendline from the record high in late January. The 200-day SMA sits at $4,481. The first minor Fib level is at $4,334.