[DAILY TRADING]: EUR/USD Analysis 10 August 2026 — Euro Holds Near 1.1550 After a Shock US Jobs Miss
 Updated Updated Mon, 2026 August 10 06:01
![[DAILY TRADING]: EUR/USD Analysis 10 August 2026 — Euro Holds Near 1.1550 After a Shock US Jobs Miss](https://www.vantagemarkets.co.id/en/wp-content/uploads/sites/22/2026/07/EURUSD_hero_8Jun2026-1-1.webp)
August 2026, the Vantage EURUSD CFD traded near 1.1554, little changed from before Friday’s US jobs shock. The pair has spent the past few sessions handing back most of a sharp midweek rally, and price now sits pinned just under a key moving average, waiting for its next cue.
What the EUR/USD Chart is Telling Us
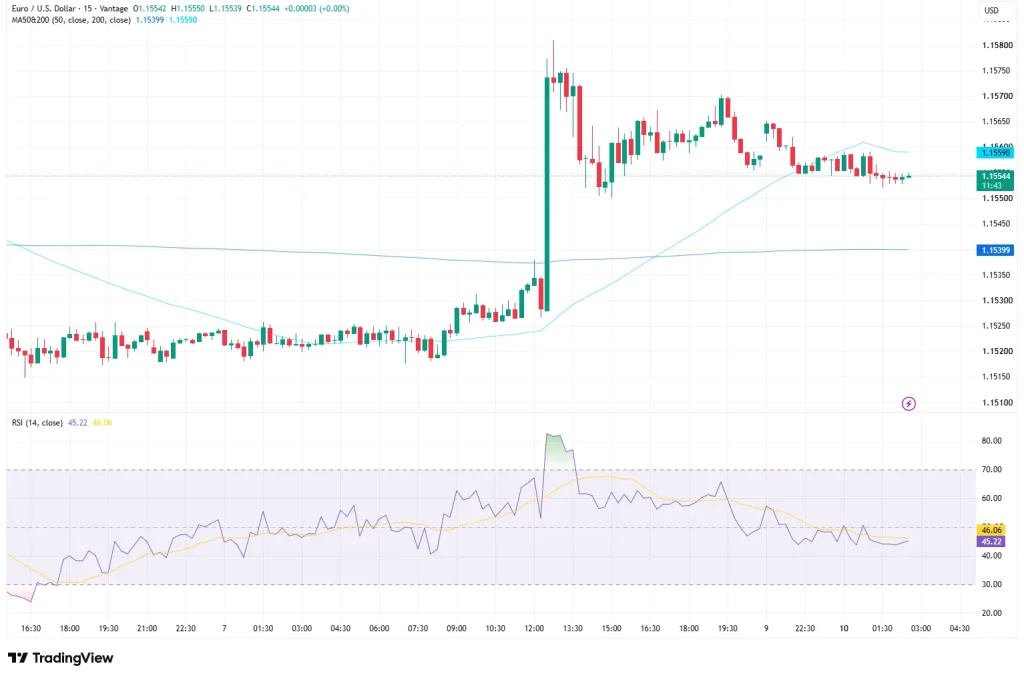
Zoom into the 15-minute EUR/USD chart and the week reads like a heart-rate monitor: flat, flat, flat, then one sharp spike, then a slow drift back to flat. Earlier in the week, the pair chopped in a tight band around 1.1520 to 1.1530 before climbing gradually into the high 1.1530s, then one strong candle carried it above 1.1570, with the session high stretching to roughly 1.1580. That spike lined up with Friday’s US jobs report, covered below, and has since mostly unwound, with price pulling back within a few candles and drifting through a wide 1.1540 to 1.1570 range since.
The 50-period moving average sits at 1.15399 and the 200-period moving average at 1.15590, per the technical analysis setup on TradingView used for this review. Price is wedged between the two, trading a touch below the 200-period line, which has acted as a soft ceiling on the last few candles. The 14-period RSI reads 45.22, with its moving average at 46.06, down sharply from the overbought spike above 70 that came with the midweek rally. Momentum has cooled off considerably, and the pair is back to drifting rather than trending.
The Jobs Report That Undercut The Dollar

Then came Friday’s number, and every desk rechecked its screen. The US Bureau of Labor Statistics reported on 7 August that nonfarm payrolls fell by 23,000 in July, against a Reuters poll that had looked for an increase of around 80,000.1 June’s reading was revised down to a 20,000 gain from an initial 57,000, and combined revisions to May and June knocked a further 103,000 jobs off the prior two months’ totals.2
The unemployment rate eased to 4.1% from 4.2%, though the drop coincided with a labour force participation rate that slipped to 61.4%, its lowest level in more than five years, not exactly a confidence signal.2 Wage growth also cooled to 3.2% year over year, the smallest annual gain since May 2021.3
The report landed a week after the Federal Open Market Committee voted 9 to 3 to hold its benchmark rate, with several officials on record favouring a possible increase in September should inflation not ease.3 Weak jobs data changes that conversation fast, and it appeared to pull some hawkish pressure back out of the dollar. The greenback slipped against the euro, the yen and most other major currencies on Friday, putting it on course for its first two-week losing streak since the end of May.4 The broader US Dollar Index softened alongside EUR/USD over the same sessions.
The Euro’s Side of the Story
On the other side of the ledger, the European Central Bank raised its key rate by 25 basis points in June, its first increase in three years, before holding steady in July.5 Money markets are already fully pricing in one further ECB increase by year end, with roughly a 40% probability of a second hike on top of that, and stronger-than-expected German factory orders for June suggest the eurozone’s largest economy might finally be finding its footing.5
That leaves EUR/USD caught between a dollar that just lost some of its rate-hike conviction and a euro carrying a modest, cautious hawkish tilt of its own, a fittingly unglamorous reason the pair keeps drifting instead of picking a lane.
Levels To Watch and Risk Framing
| Level Type | Price | Basis | What It Means |
| Resistance | 1.1580 | Session high | Top of the midweek spike |
| Resistance | 1.1559 | 200-period MA | Immediate pivot capping recent candles |
| Support | 1.1540 | 50-period MA | Short-term average, near the current range floor |
| Support | 1.1520 | Prior range floor | Where price consolidated before the spike |
Table 1: Key EURUSD reference levels as of 10:33 (GMT+8), 10 August 2026. Source: the TradingView setup used for this analysis and the Vantage EURUSD CFD feed. Reference levels, not trade signals.
The next scheduled catalyst is the US Consumer Price Index for July, due 12 August at 8:30 a.m. Eastern Time, arriving roughly five weeks before the Fed’s next meeting on 15 to 16 September and likely to shape the rate discussion.6 ECB commentary in the days ahead may also carry more weight than usual given the split pricing around a second hike.
For anyone following this pair intraday, the current range is tight enough that a Stop Loss placed too close to the market risks getting clipped by ordinary short-term noise rather than a genuine change in direction. Stop Loss placement is about limiting losses to a planned size, not about avoiding losses altogether, and it is worth setting with the 1.1520 to 1.1580 range in mind rather than the last few candles.
Leverage on EUR/USD CFDs varies by account type and jurisdiction, and it cuts both ways, turning a small move into a meaningful outcome just as easily as the reverse. Position sizing relative to account equity, not the leverage ratio itself, is what determines how much a move like this affects an account, and it is worth revisiting position size ahead of Wednesday’s inflation data given the potential for a sharper reaction.
RISK WARNING: CFDs are complex financial instruments and carry a high risk of losing money rapidly due to leverage. You should ensure you fully understand the risks involved and carefully consider whether you can afford to take the high risk of losing your money before trading.
Disclaimer: The information is provided for educational purposes only and doesn’t take into account your personal objectives, financial circumstances, or needs. It does not constitute investment advice. We encourage you to seek independent advice if necessary. The information has not been prepared in accordance with legal requirements designed to promote the independence of investment research. No representation or warranty is given as to the accuracy or completeness of any information contained within. This material may contain historical or past performance figures and should not be relied on. Furthermore estimates, forward-looking statements, and forecasts cannot be guaranteed. The information on this site and the products and services offered are not intended for distribution to any person in any country or jurisdiction where such distribution or use would be contrary to local law or regulation.
References
[1] “US nonfarm payrolls fall in July; unemployment rate eases to 4.1% – Reuters” https://finance.yahoo.com/news/us-nonfarm-payrolls-fall-july-124023322.html Accessed on 10 August 2026.
[2] “Employment Situation Summary – July 2026 – US Bureau of Labor Statistics” https://www.bls.gov/news.release/empsit.nr0.htm Accessed on 10 August 2026.
[3] “Jobs report July 2026 – CNBC” https://www.cnbc.com/2026/08/07/jobs-report-july-2026.html Accessed on 10 August 2026.
[4] “EUR USD – Euro US Dollar – Investing.com” https://www.investing.com/currencies/eur-usd Accessed on 10 August 2026.
[5] “Euro Area Currency – Trading Economics” https://tradingeconomics.com/euro-area/currency Accessed on 10 August 2026.
[6] “Consumer Price Index News Release – US Bureau of Labor Statistics” https://www.bls.gov/news.release/cpi.nr0.htm Accessed on 10 August 2026.