DAILY TRADING: Applied Materials (AMAT) Analysis 13 August 2026: AMAT Holds Near $548 Ahead of Earnings
 Updated Updated Thu, 2026 August 13 06:45

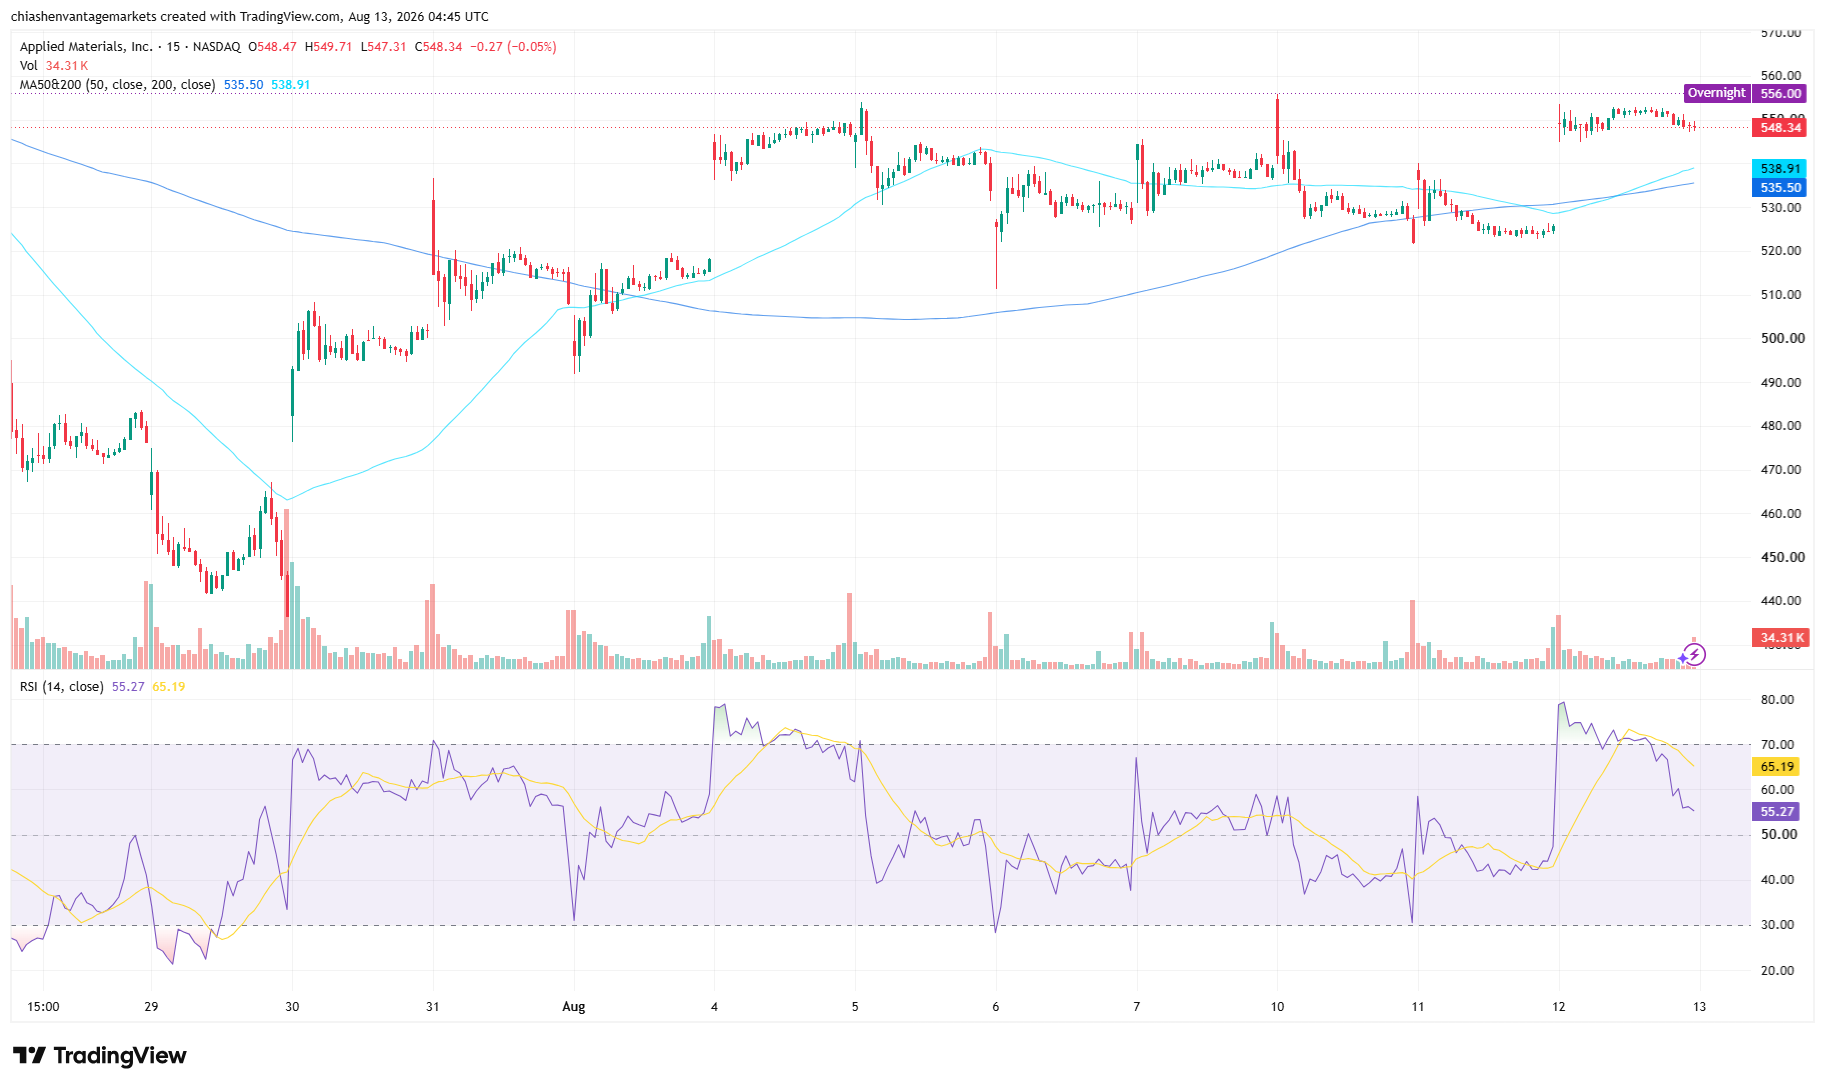
Applied Materials has spent the past two weeks falling hard, then charging back, part of the wider 2026 AI trade’s pattern. AMAT was shown at $548.34 on the TradingView chart at the 04:45 UTC (12:45 GMT+8) cut-off on 13 August 2026, ahead of the regular Nasdaq session, down $0.27, or 0.05%.[1] Applied Materials, Inc. (ticker: AMAT) reports fiscal third-quarter earnings today, after the US close, with the call at 16:30 US Eastern.[1] This reads the chart and the setup as they stand, not where the AMAT CFD price goes once the numbers land.
AMAT stock price today: what the 15-minute chart shows
AMAT fell hard into late July, printing a session low near $436 on 29 July (closing at $436.45), then one outsized candle hauled it back above $500. Price then tested the mid-$550s around 4 to 5 August, cooled into a $505 to $535 band, then found a second wind on 11 to 12 August that lifted AMAT back above both moving averages. It has since consolidated in the $540 to $550 range, roughly where the stock price for AMAT sits now.
The 50-period moving average reads 535.50 and the 200-period reads 538.91, both from the TradingView setup used here. Price has held above both since 12 August, though the 50-period line still sits marginally below the 200-period line. The 14-period RSI last printed 55.27, down from an overbought reading above 80 on 12 August.
Applied Materials stock news: why today’s earnings matter

Applied Materials reports fiscal third-quarter results after the close today, with the earnings call at 16:30 US Eastern (20:30 UTC / 04:30 GMT+8 on 14 August).[1] Consensus estimates cluster around $9.0 billion in revenue and adjusted EPS near $3.4, though the figure varies by provider: Barchart’s EPS consensus is $3.36, others closer to $3.42.[3] A result in that range would extend Applied Materials’ recent record of beating consensus EPS estimates, and would set a new quarterly revenue record if achieved, above the $7.91 billion reported last quarter.[3]
Options pricing implied a move of roughly 14%, or about $75 at the $548 reference price, for the session following the report.[2] That is wide for this stock, and it can ripple across the broader stock market beyond chip names. Applied Materials is described as the world’s largest supplier of semiconductor wafer fabrication equipment, per Morningstar.[4] Worth weighing against that optimism: the applied materials stock price now carries a forward P/E of roughly 43 times, per Barchart, well above its five-year average, and insider filings have skewed toward disposals, also per Barchart.[5]
AMAT stock forecast: where Wall Street’s price objectives stand
If you landed here searching “amat stock price target,” here’s the honest answer: it depends on which desk you ask. Citi’s Atif Malik expects Applied Materials to guide the October quarter above Street expectations.[6] UBS lifted its price objective to $705 from $570, citing evidence equipment makers are raising prices.[6] Goldman Sachs kept a positive rating with a $645 objective. Morgan Stanley raised its own objective further, to $647 from $502 on 6 July, but kept a more measured Equal Weight rating.[7] The difference is more about conviction than direction: even Morgan Stanley’s Equal Weight objective remains above the current share price.
Key levels and risk considerations
The table below lists the reference points used in this technical analysis, verified against the chart. These are levels traders are watching, not price objectives.
| Reference Point | Level | What It Reflects |
| 200-period MA | 538.91 | Longer-term average |
| 50-period MA | 535.50 | Shorter-term average, converging with the 200-period line |
| Recent swing high | ~555-560 | Tested 4 to 5 August |
| 13 August range | 547.31 – 549.71 | Today’s high and low as of the cut-off |
Table 1: Key AMAT levels, 04:45 UTC (12:45 GMT+8), 13 August 2026. Source: the TradingView setup used for this analysis. Indicative only.
What to Watch
- Earnings Call, 13 August, 16:30 US Eastern: Revenue, EPS, and guidance commentary.
- Post-Earnings Session, 14 August: Where the stock opens relative to the levels above.
Intraday ranges on AMAT CFDs could widen sharply once results are out. The 535.50 and 538.91 levels are the chart’s own moving-average support references, not a suggested Stop Loss zone; risk management decisions depend on each trader’s own account size and risk tolerance, not on where the averages sit.
Leverage works both ways, and a wide earnings-day gap can move an account balance quickly in either direction. Position sizing relative to account equity is worth revisiting ahead of a catalyst this size.
RISK WARNING: CFDs are complex financial instruments and carry a high risk of losing money rapidly due to leverage. You should ensure you fully understand the risks involved and carefully consider whether you can afford to take the high risk of losing your money before trading.
Disclaimer: The information is provided for educational purposes only and doesn’t take into account your personal objectives, financial circumstances, or needs. It does not constitute investment advice. We encourage you to seek independent advice if necessary. The information has not been prepared in accordance with legal requirements designed to promote the independence of investment research. No representation or warranty is given as to the accuracy or completeness of any information contained within. This material may contain historical or past performance figures and should not be relied on. Furthermore estimates, forward-looking statements, and forecasts cannot be guaranteed. The information on this site and the products and services offered are not intended for distribution to any person in any country or jurisdiction where such distribution or use would be contrary to local law or regulation.
References
[1] “Applied Materials (AMAT) Earnings Preview: Q3 Results Due Thursday, August 13 – Blockonomi” https://blockonomi.com/applied-materials-amat-earnings-preview-q3-results-due-thursday-august-13/ Accessed on 13 August 2026.
[2] “Applied Materials is about to report earnings. How to trade it ahead of results – CNBC” https://www.cnbc.com/2026/08/07/applied-materials-is-about-to-report-earnings-how-to-trade-it-ahead-of-results.html Accessed on 13 August 2026.
[3] “Applied Materials Q3 Preview: Stock Up 105% YTD, but Down 25% From June All-Time Highs, What Happens Next – Benzinga” https://www.benzinga.com/trading-ideas/previews/26/08/61154248/applied-materials-q3-preview-stock-up-105-ytd-but-down-25-from-june-all-time-highs-what-happens-next Accessed on 13 August 2026.
[4] “AMAT Stock – Applied Materials Stock Price – NASDAQ – Morningstar” https://www.morningstar.com/stocks/xnas/amat/quote Accessed on 13 August 2026.
[5] “Ahead of Applied Materials Earnings, Here’s What Barchart Data Says Comes Next for AMAT Stock – Barchart” https://www.barchart.com/story/news/3812894/ahead-of-applied-materials-earnings-here-s-what-barchart-data-says-comes-next-for-amat-stock Accessed on 13 August 2026.
[6] “Applied Materials (AMAT) Earnings Preview: What to Expect Thursday – MoneyCheck” https://moneycheck.com/applied-materials-amat-earnings-preview-what-to-expect-thursday/ Accessed on 13 August 2026.
[7] “Applied Materials (AMAT) Stock Price & Overview – StockAnalysis.com” https://stockanalysis.com/stocks/amat/ Accessed on 13 August 2026.