[DAILY TRADING]: USDX Analysis 19 August 2026: Dollar Index Slips as Yields Hit 19-Year High
 Updated Updated Wed, 2026 August 19 09:01
![[DAILY TRADING]: USDX Analysis 19 August 2026: Dollar Index Slips as Yields Hit 19-Year High](https://www.vantagemarkets.co.id/en/wp-content/uploads/sites/22/2026/08/USDX-Daily-Analysis-August-19-2026.webp)
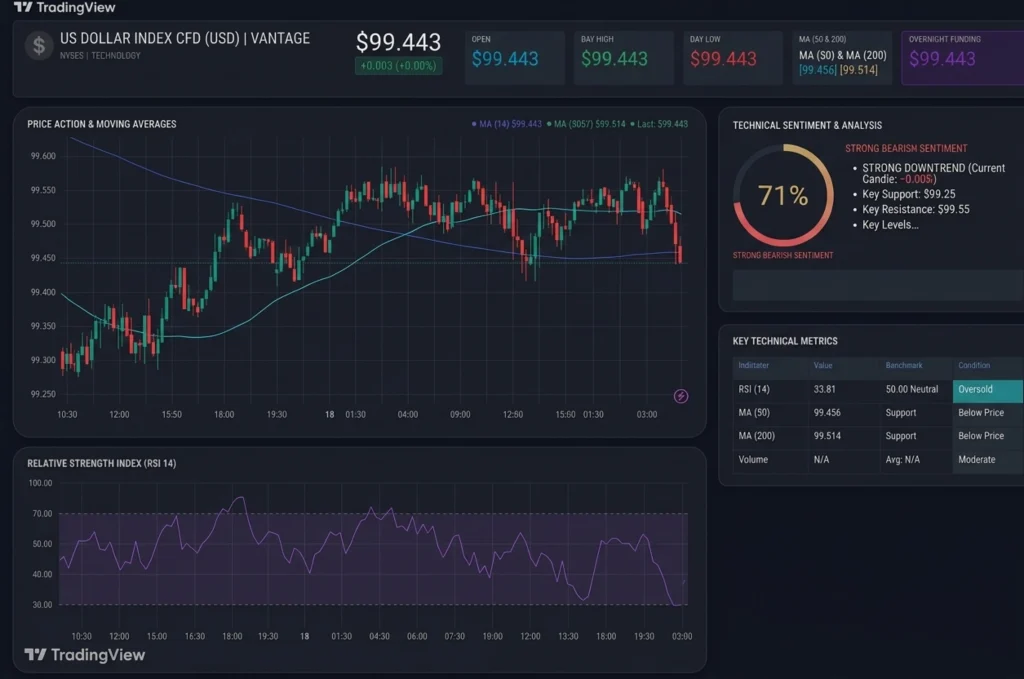
Check the US dollar index chart today and you’ll see a story that doesn’t quite add up. As of the last printed 15-minute candle on the Vantage USDX CFD chart, 14:58 (GMT+8) on 19 August 2026, USDX, sometimes called the US dollar index DXY, the DXY index, or simply the USD index, traded at 99.443, down from a session high near 99.556 the same day. That caps a third straight soft session even as the US 30-year Treasury yield sits at its highest level in 19 years. Whether you’re checking MarketWatch, TradingView, or the Vantage app, the dollar index graph is telling a story rates alone can’t explain. This piece reads the chart as of the stated cut-off and doesn’t anticipate where the index goes next.
Key Points
- USDX traded at 99.443 as of 14:58 (GMT+8) on 19 August 2026, easing from a session high near 99.556 and slipping below its 50 and 200-period moving averages.
- RSI has fallen to 33.81, down from a peak nearer 70, now below its own moving average of 47.13.
- The dollar index today has posted a third straight soft session even as the US 30-year Treasury yield sits at a 19-year high, a divergence worth watching.1,3
What the USDX Chart Is Showing
Price climbed from a session low near 99.30 late on 17 August to a high near 99.556 during the 19 August session, before drifting back to 99.443, fractionally below both the 50-period (99.456) and 200-period (99.514) moving averages, a shift from the more balanced picture earlier in the window. The Relative Strength Index (RSI) on the TradingView setup used for this analysis has fallen from levels closer to 70 during the 17 to 18 August stretch to 33.81, a fast move rather than one built in oversold territory, reading as a sharp pullback within a range rather than a confirmed reversal. The chart shows price compressing between the two averages rather than breaking cleanly in either direction.
Why the US Dollar Index Isn’t Following the Yield Playbook
Here’s the part that should raise an eyebrow. A 19-year high on the 30-year Treasury yield is often read as dollar-supportive on the surface, though it’s really a term-premium and fiscal-supply story, not a shift in Fed policy pricing. The yield traded above 5.33% on 18 August 2026, its highest since 2007.3
Instead of lifting the greenback, USDX has held a softer tone, consistent with Trading Economics‘ reporting of a third straight weaker session on cooling US data, with money markets pricing a considerably higher probability of a Federal Reserve hold than a month earlier.1 Layer in the US and Iran ceasefire, which lapsed around 17 August 2026 without extension, periodically supporting safe-haven demand without fully offsetting the softer rate outlook.4 Minutes from the Fed’s most recent meeting are due around 19 to 20 August 2026, an event that could sharpen how markets read the setup.5
Levels Traders Are Watching on the Dollar Index Chart
The levels below reflect where the Vantage USDX CFD has traded over the past two sessions, alongside the broader range reported for the index elsewhere. These are levels traders are monitoring, not trade signals.
| Instrument | Support | Resistance | What’s Happening |
| USDX | 99.30 | 99.55 / 99.70 | Holding just below the 50 and 200-period moving averages after a pullback from session highs |
Table 1: Levels as of 19 August 2026, 14:58 (GMT+8). Sources: Vantage USDX CFD (U.S. Dollar Index CFD), Investing.com. Indicative only, not trade signals.
A move back above 99.514 would put the index back inside the range that held for most of 18 August; a close below 99.30 would mark a break of the two-session low.2
What to Watch Next
- FOMC Minutes, 19-20 August 2026: Due for release, expected to show how the committee weighed recent data.5
- Jackson Hole Symposium, 27-29 August 2026: Fed Chair Kevin Warsh is scheduled to speak.
- Strait of Hormuz Developments: Any shift after the ceasefire lapse is a variable for safe-haven demand.4
- US Data Calendar: Further releases are likely to shape the odds markets assign to the Fed’s next move1 , trackable via the USD news and USDX news tags.
Given how quickly the index has moved between its moving averages this week, a Stop Loss remains a straightforward way to define acceptable exposure ahead of the FOMC minutes, information to plan around, not a recommendation.
Leverage in the USDX works both ways, scaling gains and losses equally, so position sizing deserves attention too. Leverage of up to 1:1000 is available to eligible accounts via Vantage, applying equally regardless of direction, worth revisiting ahead of the minutes.
RISK WARNING: CFDs are complex financial instruments and carry a high risk of losing money rapidly due to leverage. You should ensure you fully understand the risks involved and carefully consider whether you can afford to take the high risk of losing your money before trading.
Disclaimer: The information is provided for educational purposes only and doesn’t take into account your personal objectives, financial circumstances, or needs. It does not constitute investment advice. We encourage you to seek independent advice if necessary. The information has not been prepared in accordance with legal requirements designed to promote the independence of investment research. No representation or warranty is given as to the accuracy or completeness of any information contained within. This material may contain historical or past performance figures and should not be relied on. Furthermore estimates, forward-looking statements, and forecasts cannot be guaranteed. The information on this site and the products and services offered are not intended for distribution to any person in any country or jurisdiction where such distribution or use would be contrary to local law or regulation.
References
[1] “United States Dollar” – Trading Economics https://tradingeconomics.com/united-states/currency Accessed on 19 August 2026.
[2] “DXY US Dollar Index” – Investing.com https://www.investing.com/indices/usdollar Accessed on 19 August 2026.
[3] “30-Year Treasury Yield Tops 5.33%, New 19-Year High, on Inflation and Spending Concerns” – CNBC https://www.cnbc.com/2026/08/18/treasury-yields-.html Accessed on 18 August 2026.
[4] “CNBC Daily Open: US-Iran Ceasefire Set to Expire” – CNBC https://www.cnbc.com/2026/08/17/cnbc-daily-open-us-iran-war-ceasefire-expire.html Accessed on 17 August 2026.
[5] “Meeting Calendars and Information” – Board of Governors of the Federal Reserve System https://www.federalreserve.gov/monetarypolicy/fomccalendars.htm Accessed on 19 August 2026.