[DAILY TRADING]: XAGUSD Analysis 19 August 2026 — Silver Holds $63 as RSI Rebounds Off 20s
 Updated Updated Wed, 2026 August 19 08:59
![[DAILY TRADING]: XAGUSD Analysis 19 August 2026 — Silver Holds $63 as RSI Rebounds Off 20s](https://www.vantagemarkets.co.id/en/wp-content/uploads/sites/22/2026/08/XAGUSD-Daily-Analysis-August-19-2026.webp)
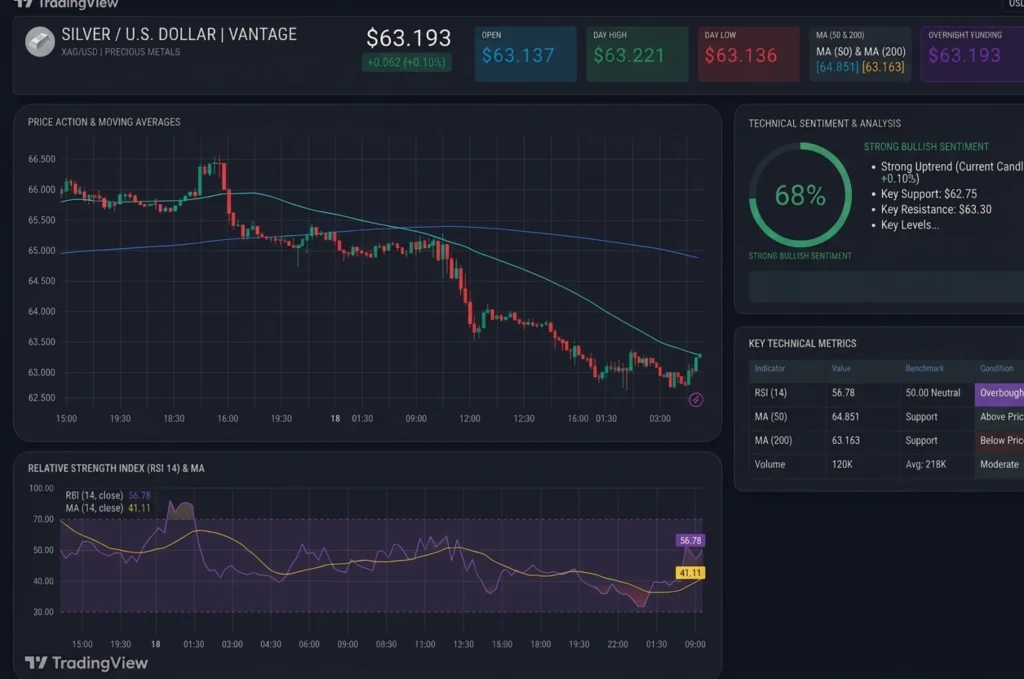
Let’s start with the number that matters: $63.19. That’s where XAGUSD, the ticker for silver against the US dollar, sat as of 11:46 (GMT+8) on 19 August 2026, per the Vantage XAGUSD CFD 15-minute chart used for this analysis, up $0.06 after opening at $63.14.1 A modest gain, after a rough 48 hours to get there.
The silver spot price fell from an intraday high above $66.50 in the early hours of 18 August to a low near $62.60 around midnight into 19 August, before finding its footing.1 So what is silver trading at today? A market catching its breath. Call it a silver price forecast, XAG/USD read, or just today’s chart check, this piece reads the setup as it stands, not where it’s headed, while traders await the FOMC minutes due later today.2
XAGUSD Price Forecast: What the Chart Shows
The 15-minute chart tells a simple story: a steady bleed lower through red candles, then a floor, then a slow climb back. Silver prices today sit just above the 200-period moving average at $63.163, while the 50-period average, at $64.851, hovers well overhead.1 That gap is the whole chart in miniature, a short-term pullback still playing out inside a slower-moving base that hasn’t caught up yet.
The XAGUSD price traded as low as $62.60 in the hours before this snapshot, a touch above the psychological $62.00 handle.1 Trading Economics’ own silver price tracker put the metal at $63.48 at the 18 August close, down 3.49% on the day, a level consistent with the corrective pressure that carried into this Vantage snapshot the next morning.3
RSI Says the Sell-Off Is Losing Steam
Momentum is the more interesting story. The Relative Strength Index (14) reads 56.78 on the TradingView setup used for this analysis, against a moving average of 41.11.1 That gap exists because RSI dropped into the low 20s overnight, oversold by any textbook definition, before curling back above its own average as price stabilised.1
An RSI climbing away from oversold and back through its signal line usually reads as fading downside pressure, not a fresh leg higher. FXStreet’s own read on a separate intraday timeframe put RSI(14) near 52.59 earlier in the Asian session, also neutral to firm.2 Two charts, same message: the selling has slowed, for now.
Why XAG USD Fell: Yields, Oil, and a Nervous Fed
None of this happened in a vacuum. The US 30-year Treasury yield climbed to 5.33% on 18 August 2026, its highest level since 2007, on concerns over persistent inflation and heavy government borrowing.4,5 Higher long-end yields raise the opportunity cost of holding a non-yielding asset like silver, plain and simple.
Oil added fuel. WTI crude traded close to a two-week high near $85.11 a barrel during the Asian session on 19 August, after US President Donald Trump confirmed no talks were scheduled with Iran.2 Pricier oil feeds inflation expectations, which feeds the case for the Fed staying tighter for longer, keeping the XAG USD price forecast into the FOMC minutes two-sided.
It isn’t all one-directional. Fading bets on a near-term Fed hike, plus steady industrial demand from solar, EVs, and AI data centres, have offered some support this week.3 Investors are watching the same Fed minutes, due 19 August, for clarity on last month’s split vote.5
Levels Traders Are Watching and the Risk Side of the Ledger
On the Vantage chart, the overnight low near $62.53 and the $62.00 figure are levels traders are watching on the downside, while the 50-period average near $64.85 and the prior swing high near $66.20 sit overhead.1 The 200-period average at $63.163, just under the current price, is arguably the one to watch: hold above it, and the recovery has room; slip below, and this week’s low comes back into view. Silver price now sits right at that hinge point.
None of that is a signal about where XAGUSD goes next. It’s a description of where the chart stands right now.
Stop Loss discipline is worth a mention given how much ground this instrument has covered this week. A Stop Loss order can help manage the size of a potential loss, though it won’t remove risk altogether, especially in fast-moving conditions. Vantage offers leverage of up to 1:1000 on select instruments, including metals CFDs, a double-edged tool that can magnify gains and losses alike, so position sizing is worth a second look before trading anything this volatile.
Silver’s week has been a tug-of-war between a bond market demanding higher compensation and a metal that still has real industrial legs. The chart shows the sell-off cooling; the macro backdrop keeps things two-sided. Traders following the XAGUSD news and silver news today feeds into the FOMC minutes may want to watch whether $63.163 holds. For a longer read, Vantage’s guide to trading silver (XAG/USD) and last week’s silver price today edition are worth a look, alongside the commodity market news, Federal Reserve news, technical analysis, and risk management tags, plus how silver compares with other safe haven assets.
RISK WARNING: CFDs are complex financial instruments and carry a high risk of losing money rapidly due to leverage. You should ensure you fully understand the risks involved and carefully consider whether you can afford to take the high risk of losing your money before trading.
Disclaimer: The information is provided for educational purposes only and doesn’t take into account your personal objectives, financial circumstances, or needs. It does not constitute investment advice. We encourage you to seek independent advice if necessary. The information has not been prepared in accordance with legal requirements designed to promote the independence of investment research. No representation or warranty is given as to the accuracy or completeness of any information contained within. This material may contain historical or past performance figures and should not be relied on. Furthermore estimates, forward-looking statements, and forecasts cannot be guaranteed. The information on this site and the products and services offered are not intended for distribution to any person in any country or jurisdiction where such distribution or use would be contrary to local law or regulation.
References
[1] “XAGUSD 15-Minute Chart – Vantage/TradingView” Vantage Markets CFD feed. Accessed 19 August 2026.
[2] “Silver Price Forecast: XAG/USD extends decline to near $63 amid continued energy supply risks – FXStreet” https://www.fxstreet.com/news/silver-price-forecast-xag-usd-extends-decline-to-near-63-amid-continued-energy-supply-risks-202608190333 Accessed 19 August 2026.
[3] “Silver – Price – Chart – Historical Data – News – Trading Economics” https://tradingeconomics.com/commodity/silver Accessed 19 August 2026.
[4] “30-year Treasury yield tops 5.33%, new 19-year high, on inflation and spending concerns – CNBC” https://www.cnbc.com/2026/08/18/treasury-yields-.html Accessed 18 August 2026.
[5] “30-year Treasury yield tops 5.31%, the highest in 19 years – CNBC” https://www.cnbc.com/2026/08/17/treasury-yields-federal-reserve-fomc-minutes.html Accessed 17 August 2026.