[DAILY TRADING] SP500 Analysis 14 August 2026 – SP500 Tops 7,800 as Inflation Cools, Oil Slides
 Updated Updated Mon, 2026 August 17 07:38
![[DAILY TRADING] SP500 Analysis 14 August 2026 – SP500 Tops 7,800 as Inflation Cools, Oil Slides](https://www.vantagemarkets.co.id/en/wp-content/uploads/sites/22/2026/08/SP500-Daily-Analysis-August-14-2026.webp)
Well, that escalated quickly. The Vantage SP500 Contract for Difference (CFD) sits near 7,808.10 as of 04:24 (GMT+8) on 14 August 2026, above Thursday’s record close and still within reach of that session’s intraday peak near 7,825 on the SP500 index.1 Thursday’s push above 7,800 for the first time came courtesy of a cooler-than-expected US inflation print, which took some heat off rate-hike worries.1 Unlike a passive SP500 index funds strategy, the Vantage SP500 CFD tracks the S&P500 index in real time, worth noting given a move like Thursday’s. This is a read on the tape, not a call on where the SP500 price goes next.
What the SP500 Chart Is Showing Right Now
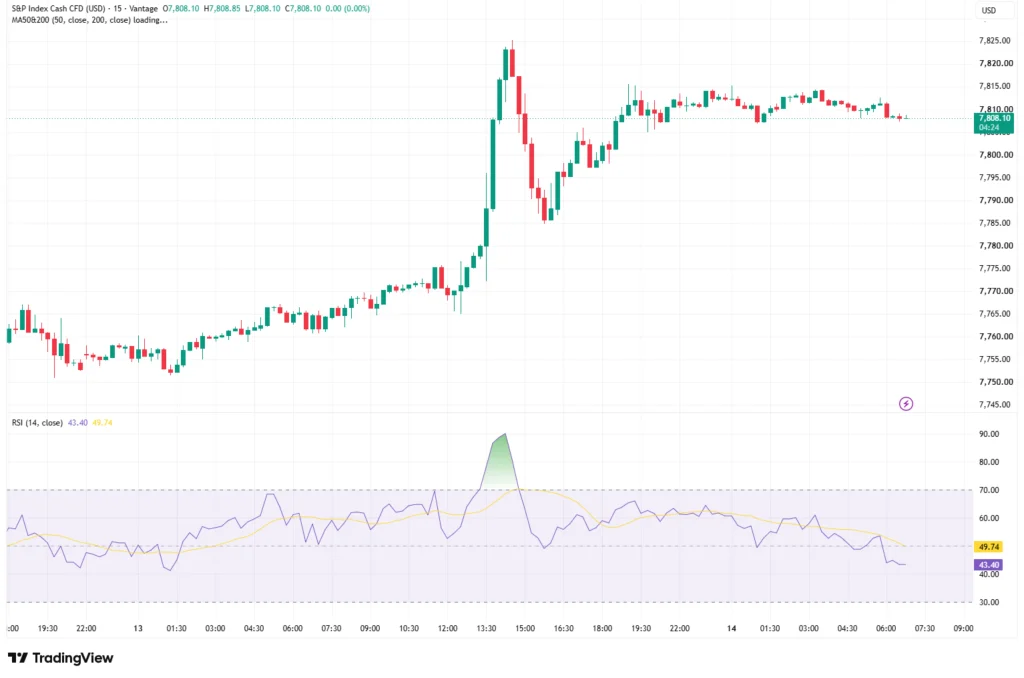
The 15-minute SP500 chart tells a clean story. Price opened the window near 7,765, dipped to 7,748, then spent the Asian and European sessions grinding higher into the 7,770s. Everything changed mid-way through Thursday’s US session: the index ran from about 7,770 to an intraday high near 7,825 in roughly 90 minutes. A pullback toward 7,785 followed, and price has spent the hours since chopping inside a tighter 7,805 to 7,815 band.
The Relative Strength Index (RSI) has cooled right alongside it, now reading 43.40 against a signal average near 49.74, attributed to the TradingView setup used for this analysis. The chart’s 50 and 200-period moving averages had not finished loading at this cut-off, so there’s no read there today.
Behind the Record: Inflation, Oil and the Fed
Wednesday’s softer-than-expected US inflation data appears to have done the heavy lifting. Markets are now leaning toward the Federal Reserve (Fed) holding rates steady at the Federal Open Market Committee’s (FOMC) rate decision on 16 September rather than raising them.2 The Fed left its target range unchanged at its July meeting, though three regional presidents dissented in favour of a hike, the most divided vote on rate direction since 2016, with inflation still running above the Fed’s 2% target.5 A gentler inflation print hands the ‘hold’ camp a bit more support heading into September’s decision.
Oil played its part too. Brent and WTI crude both eased more than 2% on Thursday even as the Middle East conflict continued, and cheaper energy generally eases pressure on the Fed’s inflation arithmetic. 1 Cisco and Cerebras shares fell sharply after their results, among the earnings names catching attention, while the broader technology rebound kept extending. 1
What’s on Deck for the SP500 Index Today
Friday brings its own test. The US Census Bureau publishes July retail sales at 08:30 Eastern Time (ET), one of the last big consumer-spending reads before the Fed’s Jackson Hole address.3 Economists were looking for a modest month-on-month gain. 4 Preliminary University of Michigan consumer sentiment follows at 10:00 ET the same morning. 6 Anyone tracking SP500 index today levels should watch these two prints, the ones most likely to jolt the range.
SP500 Levels in Focus
| Level | Price (approx.) | What’s Happening |
| Resistance | 7,825 | Thursday’s breakout high |
| Pivot | 7,798 to 7,800 | Prior record close, now acting as a swing point |
| Support | 7,785 | Thursday’s post-spike pullback low |
| Wider Support | 7,765 to 7,770 | Base of the pre-breakout range |
Table 1: Reference levels derived from the Vantage SP500 CFD 15-minute chart as of 04:24 (GMT+8), 14 August 2026. Indicative only, not trade signals.
A clean break and hold outside the 7,785 to 7,825 band would say more than anything happening inside it right now. Until that happens, the sp500 stock price today looks like it is digesting Thursday’s move rather than starting a fresh one.
What to Watch Next
- US retail sales (July), 08:30 ET: the next major consumer-spending signal, and a data point the Fed will have in hand at Jackson Hole.3
- Preliminary University of Michigan consumer sentiment: follows at 10:00 ET the same morning, offering a read on household confidence.6
- The FOMC rate decision on 16 September: the next scheduled point where the Fed confirms whether it holds or moves on rates.
The overnight range between Thursday’s pullback low and the fresh high has been narrow, but Friday’s data carries enough weight to move it quickly in either direction. Stop Loss placement around the 7,785 support and 7,825 resistance area matters more than usual heading into the print, and anyone holding correlated dollar or rate-sensitive positions may want to check their combined exposure before the data lands.
Leverage works both ways in a data-driven session like this one: it can just as easily magnify a loss as a gain, so position sizing relative to account equity is worth revisiting ahead of the print, rather than after it. The Risk Management hub covers Stop Loss discipline and position sizing in more depth, and the SP500 trading guide is a good primer on sp500 performance. For live pricing, check the SP500 CFD page and the latest SP500 news.
RISK WARNING: CFDs are complex financial instruments and carry a high risk of losing money rapidly due to leverage. You should ensure you fully understand the risks involved and carefully consider whether you can afford to take the high risk of losing your money before trading.
Disclaimer: The information is provided for educational purposes only and doesn’t take into account your personal objectives, financial circumstances, or needs. It does not constitute investment advice. We encourage you to seek independent advice if necessary. The information has not been prepared in accordance with legal requirements designed to promote the independence of investment research. No representation or warranty is given as to the accuracy or completeness of any information contained within. This material may contain historical or past performance figures and should not be relied on. Furthermore estimates, forward-looking statements, and forecasts cannot be guaranteed. The information on this site and the products and services offered are not intended for distribution to any person in any country or jurisdiction where such distribution or use would be contrary to local law or regulation.
References
[1] “S&P 500 closes at a new record, buoyed by cooler-than-expected inflation data and falling oil prices – CNBC” https://www.cnbc.com/2026/08/12/stock-market-today-live-updates.html Accessed on 14 August 2026.
[2] “Stock Market Today: Dow, S&P Live Updates for August 14 – Bloomberg” https://www.bloomberg.com/news/articles/2026-08-13/asian-stocks-set-for-gains-as-us-inflation-cools-markets-wrap Accessed on 14 August 2026.
[3] “Advance Monthly Sales for Retail and Food Services – US Census Bureau” https://www.census.gov/retail/marts/www/marts_current.pdf Accessed on 14 August 2026.
[4] “Retail sales and core retail sales among economic data due Friday – Investing.com” https://www.investing.com/news/stock-market-news/retail-sales-and-core-retail-sales-among-economic-data-due-friday-93CH-4858936 Accessed on 14 August 2026.
[5] “Fed rate decision July 2026: Divided Fed holds interest rates steady – CNBC” https://www.cnbc.com/2026/07/29/fed-rate-decision-july-2026.html Accessed on 14 August 2026.
[6] “Surveys of Consumers – University of Michigan” https://www.sca.isr.umich.edu/ Accessed on 14 August 2026.