[DAILY TRADING]: Crude Oil Prices Today, 14 August 2026 – WTI and Brent Fall as US Stockpiles Surge and OPEC Cuts Demand
 Updated Updated Fri, 2026 August 14 08:02
![[DAILY TRADING]: Crude Oil Prices Today, 14 August 2026 – WTI and Brent Fall as US Stockpiles Surge and OPEC Cuts Demand](https://www.vantagemarkets.co.id/en/wp-content/uploads/sites/22/2026/08/USOUSD-UKOUSD-Daily-Analysis-August-14-2026.webp)
Crude oil prices today are dancing to the same tune they have played most of August: a rally running straight into a wall of inventory data. The Vantage USOUSD CFD (WTI crude oil price) has slipped to $80.96 a barrel, and the Vantage UKOUSD CFD (Brent oil) sits at $87.53, both giving back ground after six straight sessions higher. If crude oil news today has one headline, it is this: the storage tanks are filling up faster than the rally can climb. Levels below reflect the Vantage CFD feed as of 14:08 (GMT+8) for WTI and 13:51 (GMT+8) for Brent, 14 August 2026.
Key Points
- WTI crude oil price trades near $80.96 and Brent crude oil price near $87.53 on the Vantage CFD feed, both cooling off after a six-session climb.
- The RSI (14) reads 39.29 for WTI and 38.61 for Brent on the TradingView setup used for this analysis, a soft reading that says tired, not reversing.
US crude stockpiles jumped 17.4 million barrels last week, the biggest weekly build since January 2023, even as the IEA’s own August report describes a widening global supply deficit, not a glut. 1,2,3
USOUSD (WTI): What the Oil Price Chart Is Showing Today
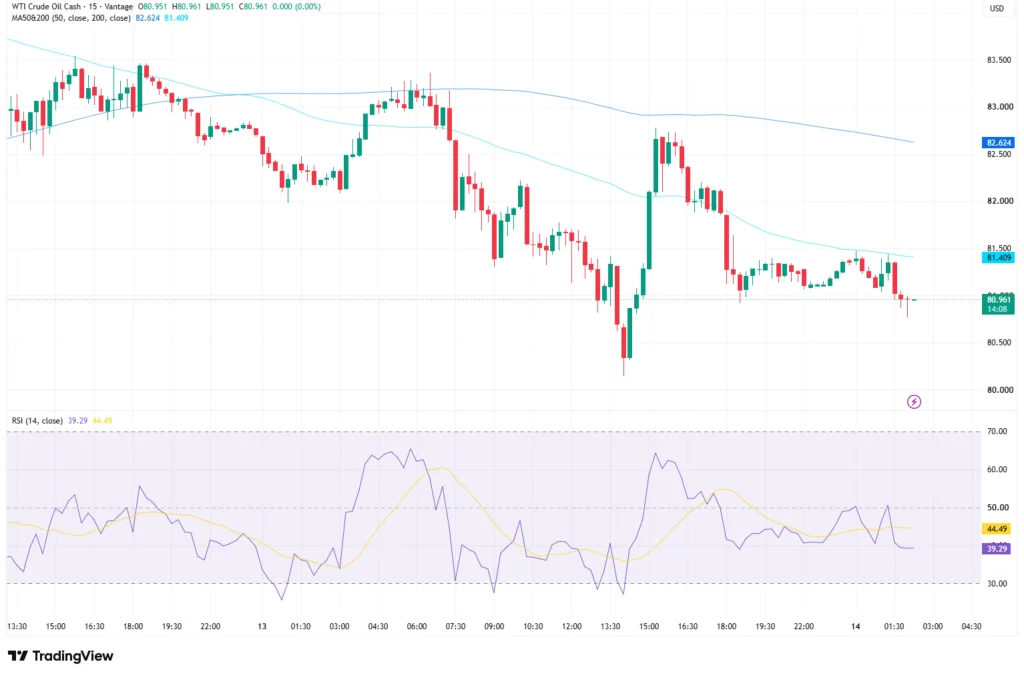
On the 15-minute Vantage USOUSD CFD chart, the WTI crude oil price opened near $83.00 and spent the session grinding lower, save for one hopeful jab back above $83.00 around midday that did not stick. Price now sits at $80.96, tucked under both its 50-period moving average at $82.62 and its 200-period average at $81.41.
The RSI (14) reads 39.29 against a 44.49 moving average, based on the TradingView setup used for this analysis. That is a soft reading, not an exhausted one. The session range has held between roughly $80.50 and $83.50 all day, and neither side has managed a decisive break either way.
UKOUSD (Brent): Brent Crude Oil Prices Today
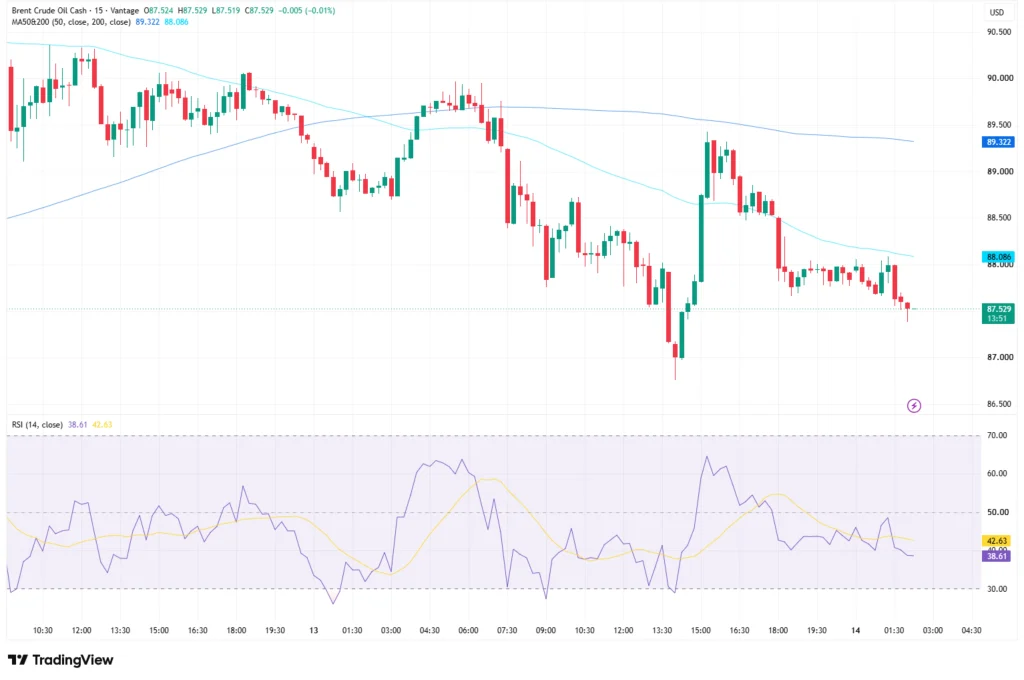
The Vantage UKOUSD CFD chart tells the same story with a British accent. Brent oil opened close to $90.00, poked above $89.50 mid-session, then drifted back to $87.53 by the cut-off, sliding under its 50-period average of $89.32 and its 200-period average of $88.09.
RSI (14) on Brent reads 38.61 against a 42.63 moving average, again per the TradingView setup used for this analysis. Brent crude oil prices today have essentially mirrored WTI’s fade, holding a $86.50 to $90.50 range without a clean break on either side.
Crude Oil News Today: Stockpiles, Hormuz, and a Demand Downgrade

The pullback in crude oil prices coincided with a heavier-than-expected US inventory report. The US Energy Information Administration said commercial crude stocks, excluding the Strategic Petroleum Reserve, rose by 17.4 million barrels in the week to 7 August, the largest weekly build since January 2023, lifting inventories to 424.4 million barrels. 1
Supply risk has not disappeared either. Efforts to normalise shipping through the Strait of Hormuz remain stalled, and the US says as much as 9 million barrels a day is still moving through the waterway, even as some tankers switch off their transponders mid-transit. 4 The broader Middle East conflict is still the quiet hand behind both charts.
On the demand side, the IEA’s August Oil Market Report cut its 2026 global demand forecast to a 1.6 million barrel-a-day contraction, citing the Hormuz closure and high prices curbing consumption. 2 The bigger story in the same report is supply: the IEA now sees global supply falling 4.3 million barrels a day this year, its steepest cut yet, leaving a projected deficit of 1.8 million barrels a day this quarter, the widest since Q4 2021. 2
OPEC, by contrast, still expects 2026 demand to grow, just more slowly, trimming its forecast to 580,000 barrels a day in its fourth straight downward revision. 3 Read together, the US had a heavy one-off inventory week, but the global balance IEA describes is tightening, not loosening, a tension worth keeping in mind alongside today’s pullback.
For ongoing coverage, follow Vantage’s Brent Crude Oil News and WTI Crude Oil News tags, or the wider Crude Oil News Today and Oil Price News Today feeds as the Hormuz story develops.
Levels to Watch and Risk Considerations
The table below covers the zones active traders are watching on both crude oil CFDs. These are reference levels, not trade signals.
| Instrument | Support | Resistance | What’s Happening |
|---|---|---|---|
| USOUSD (WTI) | $80.50 | $82.60 / $83.50 | Trading below the 50- and 200-period averages after a midday bounce faded |
| UKOUSD (Brent) | $86.50 | $88.10 / $89.50 | Holding below both moving averages following a similar intraday fade |
Table 1: Key levels as of 14:08 (GMT+8) for WTI and 13:51 (GMT+8) for Brent, 14 August 2026. Source: Vantage CFD feed and the TradingView setup used for this analysis.
Given how quickly headlines around the Strait of Hormuz and the weekly EIA report have moved both charts this week, Stop Loss placement around the support and resistance zones above matters more than it might in a calmer week. A Stop Loss limits losses to a planned size; it does not remove the risk of loss altogether, and fast-moving geopolitical headlines can still move price through a level traders had marked out in advance.
Leverage is a double-edged tool in a range like this one. It can just as easily magnify a loss as an opportunity for a return, so position sizing relative to account equity is worth revisiting ahead of next week’s EIA inventory report and any fresh developments around the Strait of Hormuz.
RISK WARNING: CFDs are complex financial instruments and carry a high risk of losing money rapidly due to leverage. You should ensure you fully understand the risks involved and carefully consider whether you can afford to take the high risk of losing your money before trading.
Disclaimer: The information is provided for educational purposes only and doesn’t take into account your personal objectives, financial circumstances, or needs. It does not constitute investment advice. We encourage you to seek independent advice if necessary. The information has not been prepared in accordance with legal requirements designed to promote the independence of investment research. No representation or warranty is given as to the accuracy or completeness of any information contained within. This material may contain historical or past performance figures and should not be relied on. Furthermore estimates, forward-looking statements, and forecasts cannot be guaranteed. The information on this site and the products and services offered are not intended for distribution to any person in any country or jurisdiction where such distribution or use would be contrary to local law or regulation.
References
[1] “Weekly Petroleum Status Report, week ending 7 August 2026 – U.S. Energy Information Administration” https://www.eia.gov/petroleum/supply/weekly/ Accessed on 14 August 2026.
[2] “Oil Market Report – August 2026 – International Energy Agency” https://www.iea.org/reports/oil-market-report-august-2026 Accessed on 14 August 2026.
[3] “OPEC Further Lowers 2026 Global Oil Demand Growth Forecast – BOE Report” https://boereport.com/2026/08/12/opec-further-lowers-2026-global-oil-demand-growth-forecast/ Accessed on 14 August 2026.
[4] “Brent Holds Decline Amid Hormuz Stalemate – Trading Economics” https://tradingeconomics.com/commodity/brent-crude-oil Accessed on 14 August 2026.