[DAILY TRADING] USDX 13 August 2026 – US Dollar Index Rebounds to 99.86 as CPI Cools, Fed Bets Shift
 Updated Updated Thu, 2026 August 13 06:39
![[DAILY TRADING] USDX 13 August 2026 – US Dollar Index Rebounds to 99.86 as CPI Cools, Fed Bets Shift](https://www.vantagemarkets.co.id/en/wp-content/uploads/sites/22/2026/08/usdx_hero-1.webp)
Wednesday tried to shake the US Dollar Index out of bed, and it did not fully work. The US Dollar Index, also called the USD Index or the DXY index, trades near 99.856 on the Vantage USDX CFD as of 10:00 (GMT+8) on 13 August 2026, clawing back an entire session’s drama in hours.1 Check the us dollar index marketwatch page or Vantage’s own us dollar index chart and you will see the same shape: a sharp CPI-day dip, then a full recovery. This update covers what the usdx chart shows, the CPI story behind it, and the levels worth knowing before today’s Producer Price Index print. All prices are as of the cut-off above, charts are from TradingView, and none of this is financial advice.
What Today’s USDX Chart is Actually Showing
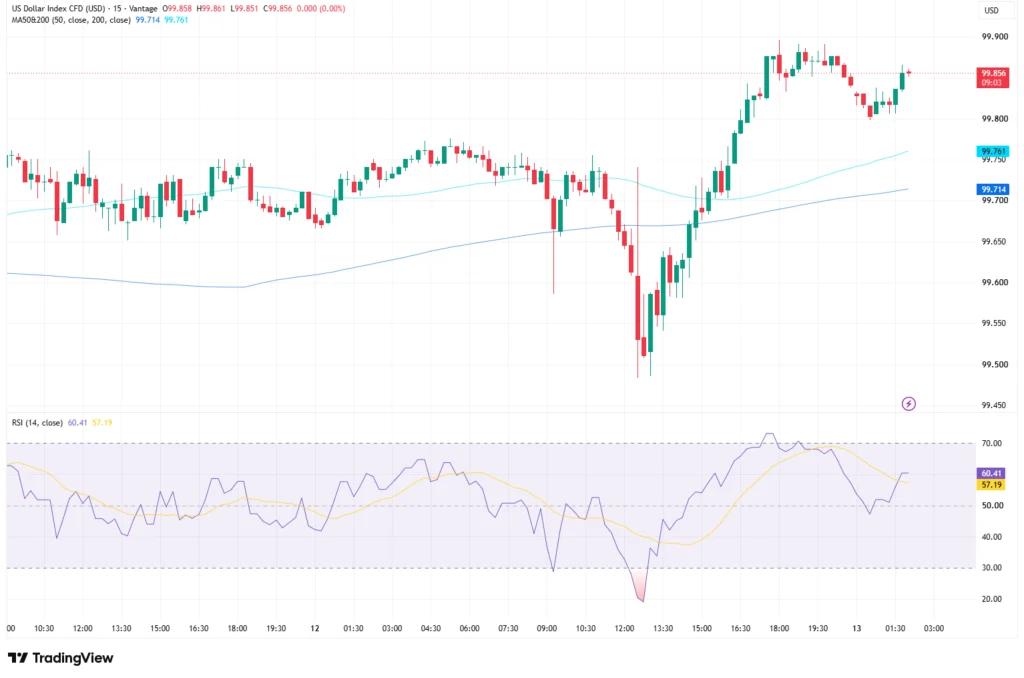
Zoom into the 15-minute dollar index chart, or the dollar index graph if you learned the name decades ago, and 12 August is the session that matters. Price idled in a tidy 99.70 to 99.80 band through the Asian and European morning, then the US Consumer Price Index hit the wires and the chart fell out of bed, extending the low toward 99.45 to 99.50.1,2
It did not stay down. USDX clawed back the entire drop within hours, pushed through the earlier range, and touched a session high near 99.90 before settling near 99.856.1 Call it a roughly 40-point round trip, the kind of move that makes one CPI release feel like a full trading week.
The index now sits above the 50-period moving average (99.714) and the 200-period moving average (99.761) on the TradingView setup used for this analysis, having reclaimed both on the way up.1 The Relative Strength Index (14) reads 60.41, signal line 57.19, comfortably bullish of neutral without flashing overbought.1
Why the DXY Index Whipsawed on CPI Day
Wednesday’s US Consumer Price Index printed exactly in line with forecasts: headline CPI rose 0.1% on the month and 3.4% on the year, while core CPI, which strips out food and energy, rose 0.2% and 2.5%.3,4 That is three straight months of core inflation at or below 0.2%, precisely the streak the Federal Reserve wants before inflation drifts back to 2%.
The knee-jerk reaction sold the US dollar index dxy, explaining the dip above. The mood then flipped: the index found a bid late in New York and closed near its 100-day SMA around 99.74.3 Fed rate hike odds for September slid from 49% to 40%, while the 10-year Treasury yield backed off resistance near 4.74% before retracing part of that move.3
Next up: July’s Producer Price Index, due today at 8:30am US Eastern Time.5 Economists expect headline PPI to cool to 4.9% year on year from 5.5%, with core easing to 4.2% from 4.7%.3 A reading that lines up with CPI reinforces this week’s inflation story; one that diverges could bring the volatility right back.
U.S. Dollar Index Levels into Today’s PPI
Here is where the dollar index today sits against the range that matters heading into the next print. These are reference levels, not trade signals.
| USDX Level | Type | What’s Happening |
| 99.761 | 200-period MA (15-min) | Nearest support, just under current price |
| 99.714 | 50-period MA (15-min) | Secondary support beneath the 200-period line |
| 99.41 | Recent support | Tested more than once this month |
| 100.00 | Round-number resistance | Caps the range with the 100-day SMA near 99.74 |
Table 1: Key USDX levels as of 10:00 (GMT+8), 13 August 2026. Sources: Vantage USDX CFD, TradingView, Vantage Markets.1,3 Indicative only.
A close back above 100.00 would put the u.s. dollar index back above the ceiling that has held since the post-jobs-report slide in early August.6 A slide under 99.41 would break a support zone already tested more than once this month.6
Managing Exposure Into the PPI Print
USDX moved close to half a point in a single session on Wednesday, more than enough to blow past a normal intraday range. Stop Loss placement around the 99.41 support and 100.00 resistance deserves a second look, and anyone holding correlated exposure elsewhere in the dollar complex, short JPY or long EUR, say, should check the combined size of that exposure rather than treating each pair alone.
Leverage lets a trader control a bigger position with less capital, and it cuts both ways with zero exceptions. On a Vantage USDX CFD, available leverage varies by entity and jurisdiction, and on a data-driven day like this it amplifies losses as readily as gains. Position sizing relative to account equity, not conviction about the PPI print, remains the more durable habit.
RISK WARNING: CFDs are complex financial instruments and carry a high risk of losing money rapidly due to leverage. You should ensure you fully understand the risks involved and carefully consider whether you can afford to take the high risk of losing your money before trading.
Disclaimer: The information is provided for educational purposes only and doesn’t take into account your personal objectives, financial circumstances, or needs. It does not constitute investment advice. We encourage you to seek independent advice if necessary. The information has not been prepared in accordance with legal requirements designed to promote the independence of investment research. No representation or warranty is given as to the accuracy or completeness of any information contained within. This material may contain historical or past performance figures and should not be relied on. Furthermore estimates, forward-looking statements, and forecasts cannot be guaranteed. The information on this site and the products and services offered are not intended for distribution to any person in any country or jurisdiction where such distribution or use would be contrary to local law or regulation.
References
[1] “DXY — U.S. Dollar Index Chart – TradingView” https://www.tradingview.com/symbols/TVC-DXY/ Accessed on 13 August 2026.
[2] “CPI, PPI, and FOMC minutes headline a two-week data window – Kraken Blog” https://blog.kraken.com/economic-brief/august-12-2026 Accessed on 13 August 2026.
[3] “Tech earnings and inline CPI boosts stocks – Vantage Markets” https://www.vantagemarkets.co.id/market-analysis/tech-earnings-and-inline-cpi-boosts-stocks/ Accessed on 13 August 2026.
[4] “Consumer Price Index News Release – 2026 M07 Results – U.S. Bureau of Labor Statistics” https://www.bls.gov/news.release/archives/cpi_08122026.htm Accessed on 13 August 2026.
[5] “Producer Price Index News Release summary – 2026 M06 Results – U.S. Bureau of Labor Statistics” https://www.bls.gov/news.release/ppi.nr0.htm Accessed on 13 August 2026.
[6] “Dollar Index (DXY): Fed Split and Jobs Shock Rattle the Greenback – Vantage Markets” https://www.vantagemarkets.co.id/market-analysis/us-dollar-index-dxy-usdx-forecast-august-10-14-2026/ Accessed on 13 August 2026.