Updated
A shooting star candlestick is one of the more recognisable shapes on a price chart: a small body sitting near the session low, topped by a long upper wick that looks like a trail of light.
A shooting star candle is a single-candle bearish reversal pattern that appears at the top of an uptrend, formed by a small real body near the session low and an upper shadow at least twice the length of that body, with little or no lower wick.
It shows up across forex, indices, commodities, and shares, which is part of why traders learn it early. Read on its own, though, it is closer to a caution flag than a confirmed turn. This guide covers how the shooting star forms, how to identify a valid one, how it differs from the inverted hammer, and how reliable it is — with a focus on reading the pattern rather than prescribing trades.
Key Points
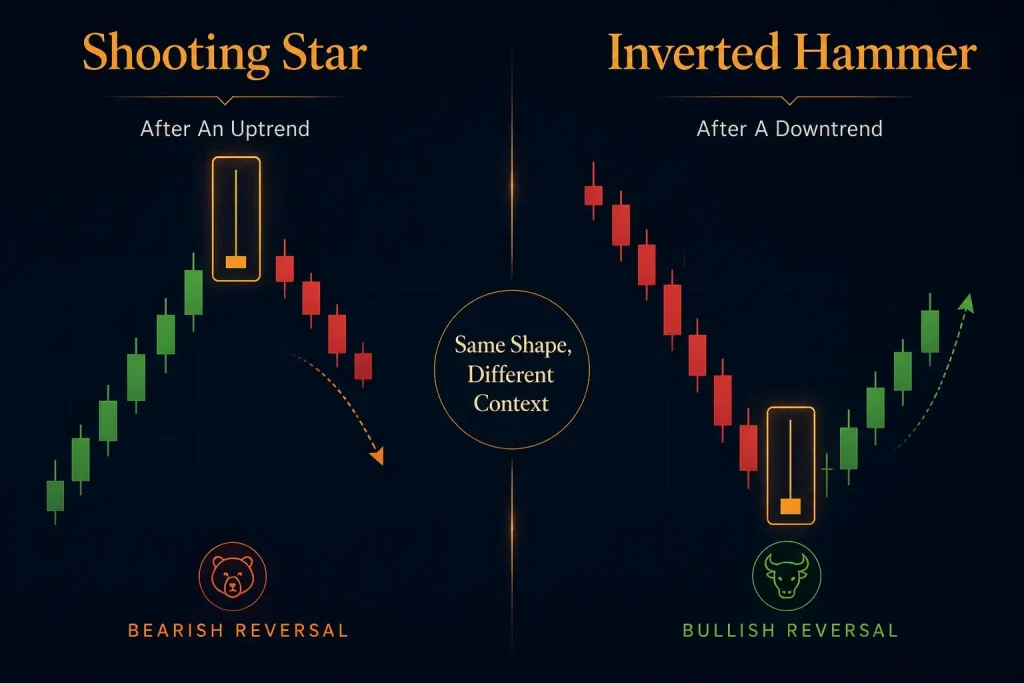
- The same candle shape carries opposite meanings depending on where it appears: after an uptrend it is read as a shooting star hinting at a possible top, while after a downtrend the identical shape is an inverted hammer hinting at a possible bottom.
- A valid shooting star has measurable proportions — a small real body near the low and an upper shadow at least twice the body length — so a candle missing any of these features is not a shooting star, whatever it resembles.
- Historical testing suggests the pattern is far from a sure thing: Thomas Bulkowski’s data found it acts as a bearish reversal about 59% of the time, which is why many traders wait for a confirming candle rather than acting on the shape alone [1].
How a Shooting Star Forms and What It Signals
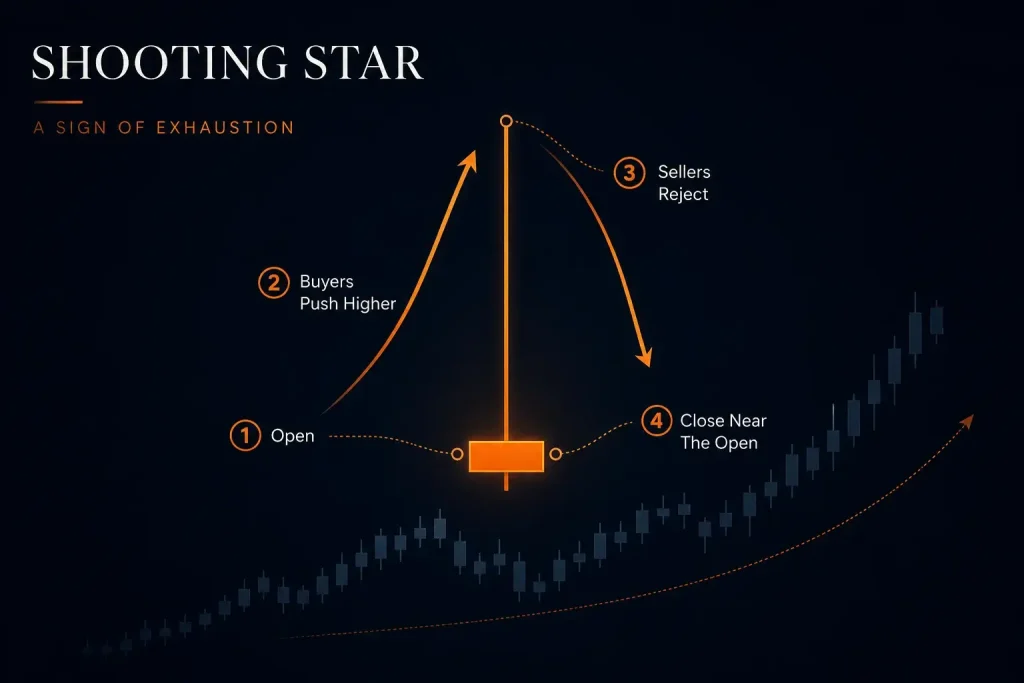
A shooting star records a single session in which buyers lost a fight they briefly looked like winning. Price opens, pushes sharply higher as buyers chase the move, then runs into selling that drags it back down to close near where it started.
The long upper wick is the footprint of that failed advance; the small body near the low shows that, by the close, almost none of the intraday gain survived.
That sequence is why the pattern is treated as a sign of exhaustion. After an extended rally, it suggests the buying pressure that drove the uptrend is meeting supply — a shift in the balance from bullish to bearish sentiment that may precede a pause or a reversal.
The signal is generally considered more meaningful when the candle forms at or near a prior resistance level, after a long advance, or on a higher timeframe such as the daily chart. It carries far less weight in a choppy, sideways market, where long wicks are common noise rather than a genuine rejection.
None of this guarantees a downturn. The shooting star describes what happened in one session; whether sellers follow through is a separate question the next candles have to answer.
How to Identify a Shooting Star
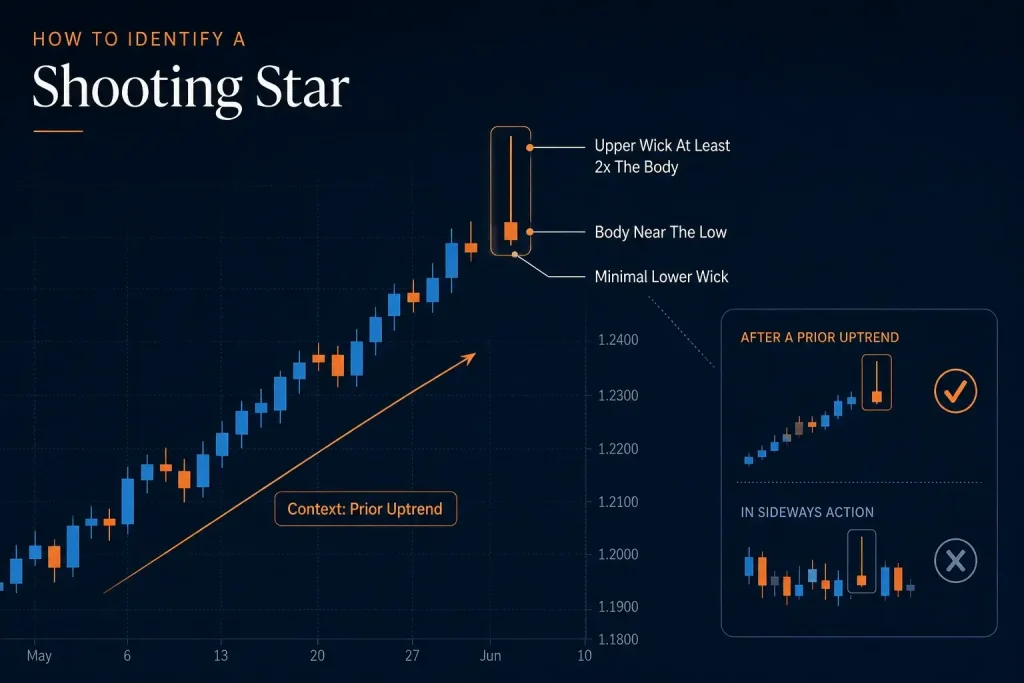
Three features must all be present for a candle to qualify as a shooting star, and they can be measured rather than eyeballed:
- Small real body near the low. The distance between the open and close is small, and it sits in the lower portion of the candle’s total range. The colour of that body does not decide validity.
- A long upper shadow. The upper wick should be at least twice the length of the real body; many descriptions use a two-to-three-times guide. This is the defining feature — it shows how far buyers pushed before being turned back.
- Little or no lower shadow. There should be minimal price action below the body. A pronounced lower wick points to a different formation, such as a spinning top.
Context is the fourth test, even though it is not part of the candle itself: a shooting star only means what it is supposed to mean after a prior uptrend. The same shape in a downtrend is read as an inverted hammer, and the same shape going nowhere is usually just noise.
This guide treats the shooting star as one member of the broader family of candlestick patterns; it is not a standalone trading system, and it does not cover position sizing or order placement.
Red vs Green Shooting Star Candlesticks
The body’s colour tells you where the close landed relative to the open. A red (bearish) shooting star closes below its open; a green (bullish) shooting star closes above it. Both can be valid shooting stars, because the pattern is defined by shape and location, not colour.
That said, a red shooting star is often regarded as the slightly stronger version. When the close finishes below the open, sellers not only rejected the highs but pushed price back beneath the starting point — a fuller reversal of the session’s early optimism.
A green shooting star still shows rejection at the top, just with a fraction of the intraday gain held onto by the close. The difference is one of degree, not direction: both point to weakening upside momentum, and neither confirms a reversal on its own.
Why the Uptrend Matters
The prior trend is what turns a shape into a signal. A shooting star is only a bearish reversal pattern if there is an uptrend for it to reverse; without a rally in front of it, the long upper wick has nothing to reject. This is why the same candle appearing in the middle of a sideways range tends to be unreliable — there is no established buying pressure for sellers to overturn.
Timeframe interacts with this. A shooting star on a daily or weekly chart, where each candle sums up a full session, is generally treated as more significant than one on a one-minute chart, where a single wick can form and vanish within minutes. On the daily chart, the close that shapes the candle lands at the end of the trading day — for many session-based instruments that is the late-afternoon settlement, well after the London–New York overlap has passed in IST terms.
Shooting Star vs Inverted Hammer
The shooting star and the inverted hammer are the same candle drawn in two different places. Both have a small body and a long upper shadow; what separates them is the trend that precedes them and, therefore, what they imply.
| Feature | Shooting Star | Inverted Hammer |
| Prior trend | Appears after an uptrend | Appears after a downtrend |
| Signal | Potential bearish reversal | Potential bullish reversal |
| Candle shape | Small body near the low, long upper shadow, little lower shadow | Identical shape — small body near the low, long upper shadow, little lower shadow |
| What it reflects | Buyers rejected at the highs | Buyers testing strength after a decline |
Because the shapes are identical, the trend context is the only thing that tells them apart — which is why misreading the surrounding trend is one of the easiest ways to misread the candle. A closely related shape is the gravestone doji, which looks like a shooting star but has its open and close at virtually the same price, giving it almost no body at all.
For a fuller treatment of the bullish mirror image, see the dedicated guide to the inverted hammer.
Confirming a Shooting Star
Because the pattern is unreliable in isolation, traders often look for confirmation before treating it as anything more than a warning. The most common approach is to wait for the next candle: when the candle after the shooting star closes below the shooting star’s body or low, it is widely taken as evidence that sellers have followed through. Acting on the shooting star the moment it forms, without that follow-through, accepts a higher chance of a false signal.
Other tools are frequently used alongside it. Higher-than-average volume on the shooting star session can suggest the rejection was broad rather than thin. Momentum readings — the Relative Strength Index (RSI) or the Moving Average Convergence Divergence (MACD), among other technical indicators — may add weight when they point the same way, for example an overbought RSI as the star forms.
None of these confirms the outcome; they stack context so a single candle is not carrying the whole decision. Confirmation reduces false signals, but it does not remove them, and it comes at the cost of a later entry.
How Reliable Is the Shooting Star Pattern?
This is where the shooting star’s reputation and its record diverge. Drawing on a database of roughly 4.7 million candle lines across 103 candlestick types, technical-analysis author Thomas Bulkowski found that the single-candle shooting star acts as a bearish reversal about 59% of the time on daily charts — a rate he describes as near random [1,2].
Its overall performance ranks 55th out of 103 patterns, squarely mid-table, and the best average move ten days after a downside break is around 3.86%, which falls short of the 6% Bulkowski treats as a strong result [1]. His summary is blunt: the candle looks better than it performs.
Two implications follow. First, the pattern is a probability tilt, not a prediction — a little better than a coin toss in isolation, which is exactly why context and confirmation matter so much. Second, variants behave differently: the two-candle version of the shooting star actually acts as a bullish continuation about 61% of the time, the opposite of what the single-candle name suggests [3]. Knowing which version is on the chart matters before reading anything into it.
A Worked Example
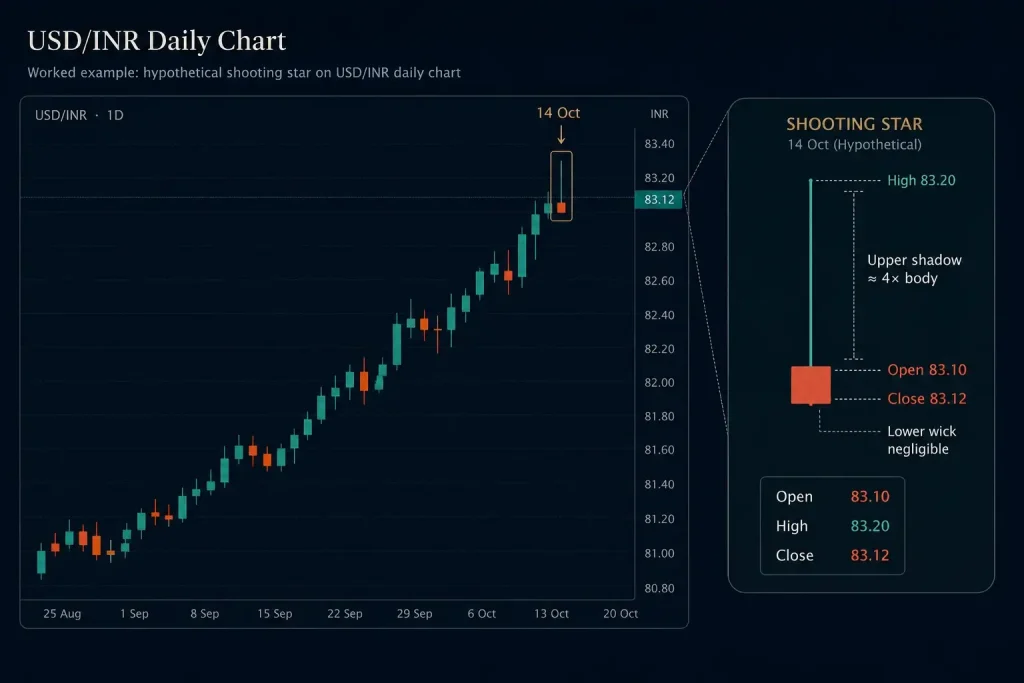
Consider a hypothetical daily candle on a USD/INR currency pair represented through a forex Contract for Difference (CFD), subject to product availability and applicable jurisdictional restrictions.
Price opens at 83.10, spikes intraday to 83.20 as buyers push, then fades to close at 83.12. The real body is about 0.02 (roughly two pips), while the upper shadow runs about 0.08 — close to four times the body, comfortably above the two-times minimum. The body sits near the low, and the lower wick is negligible. On shape alone, that is a textbook shooting star; whether it leads anywhere still depends on the prior trend and the next session’s close.
This example is hypothetical and for illustrative purposes only. It does not reflect actual trading results or client experiences.
Common False Signals and Limitations
Even a well-formed shooting star fails often, and knowing the common traps is part of using it sensibly.
A frequent one is the gap-up: price opens higher the morning after the shooting star and never looks back, catching out anyone who treated the candle as an automatic sell. Sideways markets produce long upper wicks constantly, most of which mean nothing. And a single candle, however clean, cannot outweigh a strong prevailing trend — uptrends can absorb several shooting stars before actually turning.
The practical lesson runs through all of these: the shooting star flags a moment worth watching, not a decision. Leverage can increase losses when a CFD position moves against you, which is why the pattern should be considered alongside appropriate risk management practices rather than used as a standalone decision-making tool.
Why the Shooting Star Is a Warning, Not a Signal
The shooting star earns its place in a trader’s toolkit not because it predicts reversals but because it flags rejection at highs in a single, easy-to-spot shape. Its measurable anatomy makes it hard to mistake, and its psychology — buyers overpowered near the top of a move — is genuinely informative.
What the historical record shows, though, is that the shape alone is close to a coin toss. Its value appears when it lines up with other evidence: a prior uptrend, a known resistance level, supportive volume or momentum, and a confirming candle that closes lower.
Treated that way — as a prompt to look closer rather than an instruction to act — the shooting star is a useful piece of context. Treated as a standalone signal, it disappoints about as often as it delivers.
Frequently Asked Questions
What is a shooting star candlestick pattern?
A shooting star candlestick pattern is a single-candle formation with a small real body near the session low, a long upper shadow at least twice the body’s length, and little or no lower shadow. It appears at the top of an uptrend and is read as a potential bearish reversal, showing that buyers pushed price higher during the session but sellers regained control by the close.
Is a shooting star candle bullish or bearish?
A shooting star is a bearish pattern. It forms after an uptrend and signals that upward momentum may be fading, as sellers reject higher prices and force the close back down near the open. It is not a confirmed reversal on its own, though — the following candles decide whether the shift actually follows through.
What is the difference between a shooting star and an inverted hammer?
They share an identical shape — a small body with a long upper shadow — but appear in opposite contexts. A shooting star forms after an uptrend and hints at a bearish reversal, while an inverted hammer forms after a downtrend and hints at a bullish reversal. The surrounding trend is the only thing that distinguishes them.
Does the colour of a shooting star candle matter?
Colour does not decide whether a candle is a valid shooting star; shape and location do. A red shooting star closes below its open and a green one closes above it, and both can qualify. A red shooting star is often seen as marginally stronger because sellers pushed price back below the opening level, but the difference is one of degree rather than direction.
How reliable is the shooting star pattern?
Historical testing suggests it is modest. Thomas Bulkowski’s research found the single-candle shooting star acts as a bearish reversal about 59% of the time on daily charts, ranking 55th of 103 candlestick patterns [1]. That is why it is generally used with confirmation and supporting context rather than as a standalone signal.
How do traders confirm a shooting star?
The most common confirmation is waiting for the next candle to close below the shooting star’s body or low, which suggests sellers have followed through. Some traders also look at whether volume was elevated during the session, or whether momentum indicators such as RSI or MACD point the same way. None of these guarantees a reversal; they add context to a single candle.
Can a shooting star appear on any timeframe?
Yes, the pattern can form on any timeframe, from one-minute to weekly charts. However, it is generally considered more reliable on higher timeframes such as the daily chart, where each candle reflects a full session of trading. On very short timeframes, long upper wicks form frequently and carry less meaning.
RISK WARNING: CFDs are complex financial instruments and carry a high risk of losing money rapidly due to leverage. You should ensure you fully understand the risks involved and carefully consider whether you can afford to take the high risk of losing your money before trading.
Disclaimer: The information is provided for educational purposes only and doesn’t take into account your personal objectives, financial circumstances, or needs. It does not constitute investment advice. We encourage you to seek independent advice if necessary. The information has not been prepared in accordance with legal requirements designed to promote the independence of investment research. No representation or warranty is given as to the accuracy or completeness of any information contained within. This material may contain historical or past performance figures and should not be relied on. Furthermore, estimates, forward-looking statements, and forecasts cannot be guaranteed. The information on this site and the products and services offered are not intended for distribution to any person in any country or jurisdiction where such distribution or use would be contrary to local law or regulation.
References
- Bulkowski on the Shooting Star Candle Pattern — ThePatternSite (Thomas Bulkowski). https://thepatternsite.com/ShootingStar.html Accessed 8 Aug 2026
- “The Eight Best-Performing Candles — Thomas N. Bulkowski, Technical Analysis of Stocks & Commodities. https://www.fidelity.com/bin-public/060_www_fidelity_com/documents/EightBestCandles.pdf Accessed 8 Aug 2026
- “Bulkowski on the 2 Line Shooting Star Candle Pattern — ThePatternSite” (Thomas Bulkowski). https://thepatternsite.com/ShootingStar2.html Accessed 8 Aug 2026