Updated
Support and resistance are price levels on a chart where a market has repeatedly paused or reversed direction. Support is a level where a falling price tends to find enough buying interest to slow or halt the decline, while resistance is a level where a rising price tends to meet enough selling interest to cap an advance.
Traders across indices, commodities, and currencies watch these levels to judge where price might stall, turn, or break through, and to plan where they place entries, stops, and targets. The same logic reads across markets, from a benchmark index such as the Nifty 50 to gold and major currency pairs — and it matters most in the moments a level either holds or gives way.
Key Points
- Support marks a price floor where buying interest has repeatedly slowed a decline, while resistance marks a ceiling where selling pressure has repeatedly capped a rise; both are zones of probability, not guarantees.
- The most-watched levels come from a handful of repeatable methods: prior swing highs and lows, trendlines, moving averages, Fibonacci retracements, and pivot points, and a level’s credibility grows the more times price has tested it and held.
- When a level finally breaks, its role often flips, so broken resistance can become new support and broken support can become new resistance, which is why false breakouts and retests matter as much as the level itself.
What Are Support and Resistance?
Support and resistance describe the two boundaries that tend to contain a market’s price movement. They come from the balance between supply and demand: when buyers are willing to step in at a certain price, they create a floor; when sellers consistently emerge at another, they create a ceiling.
Support is a price zone where demand has been strong enough to stop a decline. As price falls towards it, buyers have historically become more willing to enter and sellers less willing to exit, and that shift in the balance can slow or reverse the move. Resistance is the mirror image: a price zone where supply has been strong enough to stop an advance, as sellers turn more active and buyers more hesitant.
Neither level is a hard barrier. Price can trade through both, and often does. It is more accurate to treat them as areas of probability where a reaction is more likely, not fixed points where a reaction is certain.
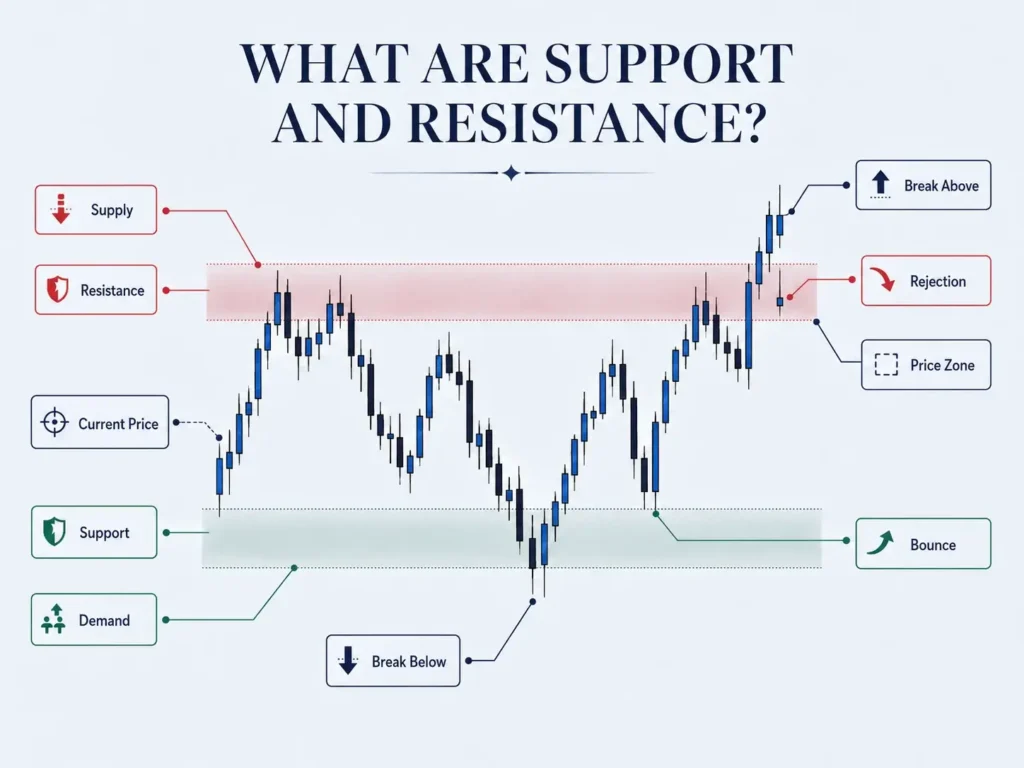
| Feature | Support | Resistance |
| Position on chart | Below the current price | Above the current price |
| Dominant force | Buying interest (demand) | Selling interest (supply) |
| Typical reaction | Price slows, pauses, or bounces up | Price slows, pauses, or turns down |
| What a break may signal | Selling has overwhelmed demand | Buying has overwhelmed supply |
Because both levels come from the same supply-and-demand dynamic, the tools you use to find one work equally well for the other.
Why Support and Resistance Levels Form
Support and resistance work largely because enough market participants expect them to. When many traders watch the same price zone and act in similar ways around it, their combined orders can make the level behave as anticipated. A few overlapping behaviours drive this.
- Memory and anchoring: Once price has turned sharply at a level, traders remember it and tend to anchor future expectations to that zone. A buyer who missed an entry there may wait for price to return, adding demand at the same spot.
- Order clustering: Buy orders, sell orders, stop-losses, and profit targets tend to gather around visible reference prices. Academic work on stock-price clustering has documented that orders concentrate at round numbers and familiar levels, which can amplify a reaction when price arrives there [1].
- Round numbers: Prices ending in round figures, such as 24,000 on a benchmark index or 4,000 on gold, attract disproportionate attention. They are easy to remember and often become informal targets, so they frequently act as psychological support or resistance.
- Shared signals: When analysts and financial media highlight the same level on the Nifty 50 or an actively traded stock, more participants watch it, and that shared focus can turn a price zone into a self-reinforcing reference point.
None of this makes a level certain. It explains why levels tend to matter, through the concentration of supply and demand around a remembered price, without implying the market is obliged to respect them.
How to Identify and Draw Support and Resistance Levels
Most support and resistance levels come from a small set of repeatable methods. Some are static horizontal lines; others are dynamic and move with price. You can combine several, and a level carries more weight when more than one method points to the same zone.
- Swing highs and lows: The most direct method is to mark the prices where the market has clearly turned before. Recent swing lows form potential support; recent swing highs form potential resistance.
- Trendlines: A trendline is a diagonal line connecting a series of higher lows in an uptrend or lower highs in a downtrend. In an uptrend, the rising line beneath the lows can act as dynamic support; in a downtrend, the falling line above the highs can act as dynamic resistance.
- Moving averages: Widely followed averages such as the 20-day, 50-day, and 200-day often behave like moving support or resistance, because so many traders reference them. Price frequently pulls back towards one of these lines before continuing.
- Fibonacci retracements: Measured between a swing low and a swing high, the Fibonacci retracement levels of 23.6%, 38.2%, 50%, 61.8%, and 78.6% often align with zones where price pauses. Many traders treat them as reference areas rather than exact prices.
- Pivot points: These are calculated from the previous session’s high, low, and close to produce a central pivot plus support levels (S1, S2, S3) and resistance levels (R1, R2, R3).
| Method | Type | What it shows | Best suited to |
| Swing highs and lows | Static | Prior turning points on the chart | All timeframes and markets |
| Trendlines | Dynamic | Diagonal support or resistance along a trend | Trending markets |
| Moving averages (20/50/200) | Dynamic | Moving reference levels many traders watch | Trend pullbacks |
| Fibonacci retracements | Static zones | Reference levels within a prior move | Pullbacks inside a trend |
| Pivot points (S1–S3, R1–R3) | Static (daily) | Objective levels from prior session data | Intraday index and FX work |
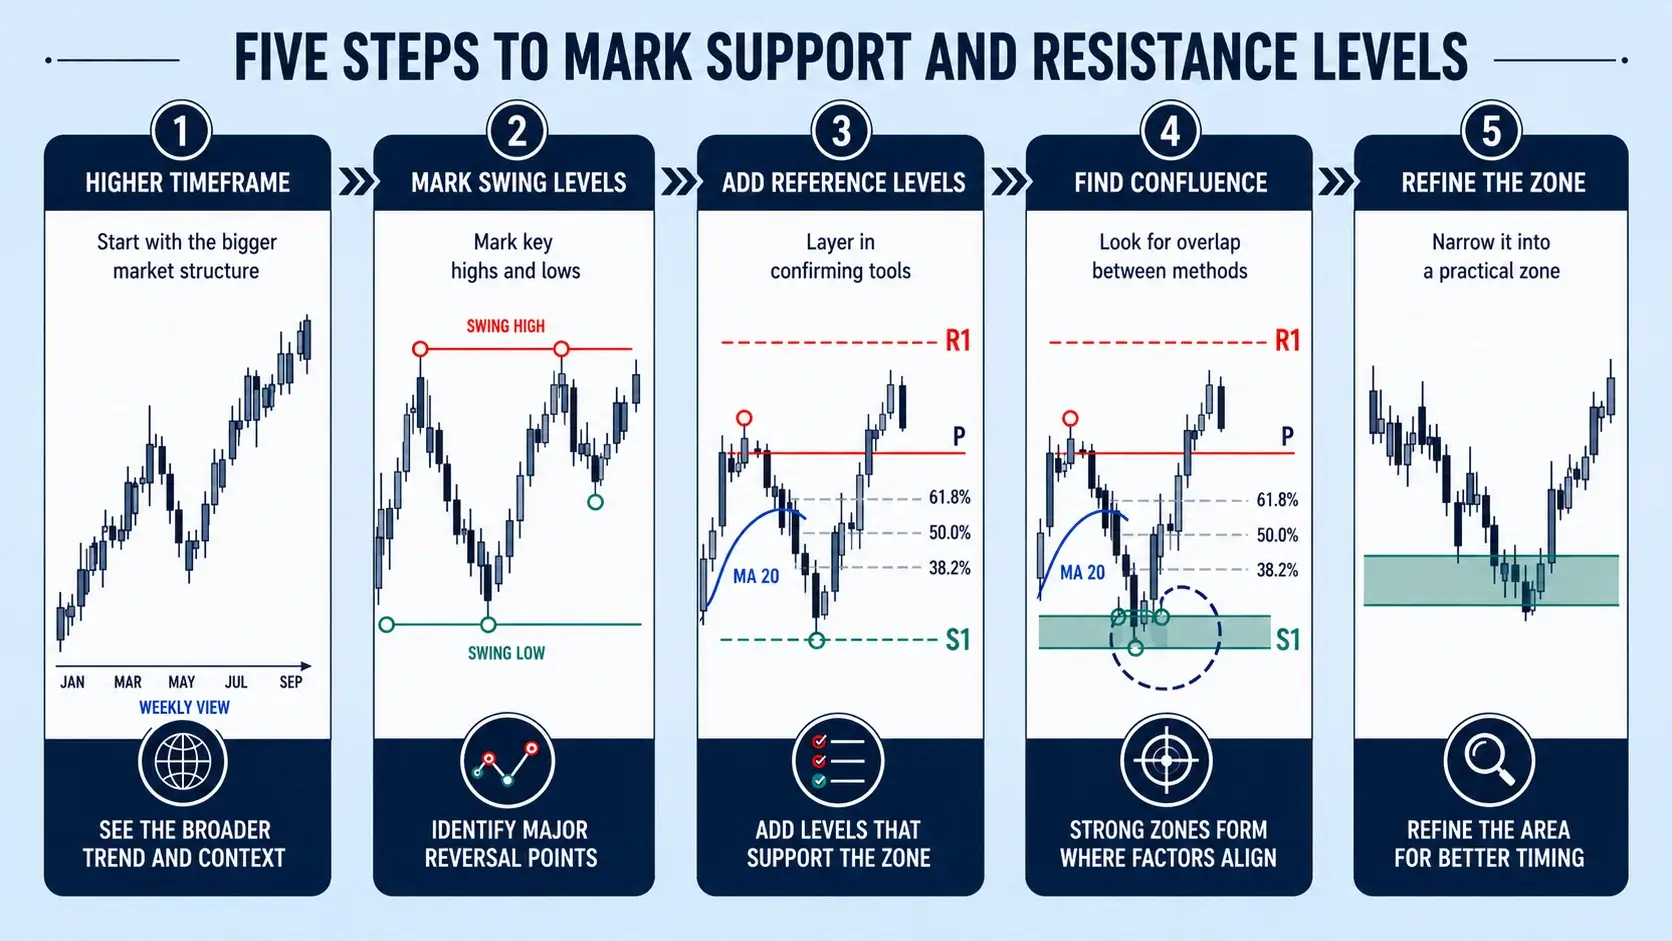
A repeatable way to mark levels on any chart, whether a Nifty futures contract, a gold CFD, or a currency pair, follows a few steps:
- Start on a higher timeframe, such as the daily chart, to find the levels that matter most.
- Mark the clearest swing highs and swing lows where price turned sharply.
- Add any moving averages, Fibonacci levels, or pivots that overlap those zones.
- Look for confluence, where two or more methods agree, as those areas carry more weight than a single line.
- Drop to your trading timeframe to refine entries, and treat each level as a zone rather than an exact price.
Drawing levels well takes practice, and it helps to study how price has reacted at them across many trading charts before relying on them.
How to Calculate Pivot Points
Pivot points are popular for intraday work on indices such as the Nifty 50 and Bank Nifty because they are objective and widely shared. The central pivot uses a simple formula:
The first support and resistance levels can then be calculated as follows:
- First Resistance (R1): (2 × P) − Low
- First Support (S1): (2 × P) − High
Pivot Point Calculation Example
Suppose an index CFD recorded the following prices during the previous trading session:
- High: 24,200
- Low: 23,900
- Close: 24,050
The central pivot point would be:
P = (24,200 + 23,900 + 24,050) ÷ 3 = 24,050
Using this pivot point:
- R1 = (2 × 24,050) − 23,900 = 24,200
- S1 = (2 × 24,050) − 24,200 = 23,900
These levels may then be used as reference areas when observing how the price moves during the next trading session.
This example is hypothetical and for illustrative purposes only. It does not reflect actual trading results or client experiences.
Zones, Strength, and Role Reversal
Treating support and resistance as thin lines is one of the most common beginner mistakes. Real markets rarely turn at a single price to the tick. It is more useful to think in zones, a band a few points or pips wide where reactions cluster, because that reflects how orders actually sit in the market.
Not every level deserves equal attention. A few factors tend to make a zone more significant.
- Number of touches: A level tested three or more times and still holding has proven itself more than one touched only once.
- Volume: Heavy trading activity at a zone suggests genuine interest from larger participants, not a passing reaction.
- Timeframe: Levels drawn on daily and weekly charts generally carry more weight than those on a five-minute chart, because more participants act on them.
When price does push decisively through a level, one of the more reliable behaviours in technical analysis often follows: role reversal, also called polarity. Broken resistance frequently becomes new support, and broken support frequently becomes new resistance. If a benchmark index clears a long-standing ceiling and later pulls back, that former ceiling can act as a floor on the retest.
Breaks are not always genuine, though. A false breakout, or fakeout, happens when price pushes past a level, triggers orders, then snaps back inside the range. This is why many traders wait for confirmation rather than entering the instant a level breaks. Confirmation can come from a close beyond the level, a rise in volume, a supportive candlestick pattern at the retest, or a recognisable chart pattern forming around the zone.
The practical lesson is that a level is information, not an instruction. It tells you where a reaction is more likely, and confirmation tells you whether that reaction is actually happening.
Using Support and Resistance Across Markets
One reason support and resistance is worth learning early is that the same logic reads across almost every market. Retail traders typically access these markets through Contracts for Difference (CFDs), which are instruments that let you speculate on price movement without owning the underlying asset, so the levels apply whether you are looking at an index, a commodity, or a currency.
- Index CFDs: On a benchmark such as the Nifty 50, Bank Nifty, or the BSE Sensex, round-number levels and prior session pivots tend to attract attention. Traders studying indices trading strategies often mark these zones before the session opens in IST.
- Commodity CFDs: Gold, quoted as XAU/USD and also traded on the MCX, has well-followed historical levels that the market revisits repeatedly. Round dollar figures often serve as informal reference points.
- Forex CFDs: Currency pairs such as USD/INR respect horizontal levels and trendlines in the same way, with liquidity concentrating around familiar prices.
The mechanics are identical; only the instrument changes. Being able to read one chart transfers directly to the next.
Where CFDs differ from the underlying market is leverage. Leverage lets you control a larger position with a smaller deposit, and it magnifies both gains and losses in equal measure. A trade built around a clean support level can still move against you sharply if the level fails, and leverage means the loss on that position is amplified. For that reason, the level itself is only half the plan: how you size the position and where you place the stop matter just as much.
A Real Example: Role Reversal on XAU/USD
Gold, quoted as XAU/USD, provides an illustrative example of these ideas. On a historical daily chart, the area around 4,000 to 4,150 acted as resistance during the consolidation of October and November 2025, when price repeatedly stalled there. After gold later rallied before declining, price returned to that same 4,000 to 4,150 band, where it acted as support. This illustrates the role-reversal concept described earlier.

Two things stand out. The first is role reversal: a band that once capped the price later served as a floor, exactly the polarity effect described earlier. The second is the pull of the round number, with 4,000 acting as a natural reference point. None of this guarantees the zone will hold. A decisive close below it would signal that support had failed, and under leverage that kind of break can turn into an outsized loss. A real level is a place to plan around, not a promise about what comes next.
The above example is for illustrative purposes only and does not constitute a recommendation to buy, sell, or hold any financial instrument.
Managing Risk When Trading Support and Resistance
A support or resistance level defines where an idea is right or wrong, which makes it a natural anchor for risk control. The level marks the point at which your reasoning no longer holds.
- Stop placement: Many traders place a stop-loss order just beyond a level, below support for a long position or above resistance for a short, so that a clean break closes the position before the loss grows.
- Risk-to-reward: Because a level gives a defined invalidation point, it also lets you measure a trade’s risk against its potential reward. A common reference is aiming for a reward at least twice the size of the risk, for example risking 100 points to target 200, though no ratio rescues a weak setup.
- Waiting for confirmation: Entering the moment price touches a level exposes you to false breakouts. A confirming close or a supportive signal can reduce that risk, at the cost of a slightly later entry.
The larger point is that support and resistance is one input into risk management, not a substitute for it. Leverage magnifies both gains and losses, and even a well-chosen level fails often enough that position sizing and stops do the real work of protecting capital. A level shows you where to look; disciplined risk control decides how much you can afford to be wrong.
Reading Levels, Not Predicting Them
Support and resistance endure as core concepts because they describe something real about how markets behave: prices carry memory, and participants react around the levels they remember. Support is where demand has tended to halt a fall; resistance is where supply has tended to cap a rise.
The methods for finding them, from swing points and trendlines to moving averages, Fibonacci, and pivots, all point at the same thing from different angles, and a level earns respect through repeated testing and confluence.
What separates a useful level from a misleading one is context. A level marks where a reaction is more likely, not where it is certain, and its role can flip the moment it breaks. Read alongside confirmation, position sizing, and a clear stop, support and resistance becomes a framework for planning trades and managing risk across indices, commodities, and currencies, rather than a set of lines that promise where price must go.
Frequently Asked Question
What Is Support and Resistance in Trading?
In trading, support and resistance are price zones where a market has repeatedly slowed or reversed. Support sits below the current price, where buying interest has tended to halt declines; resistance sits above it, where selling pressure has tended to cap advances. Traders use them to judge where price may pause or turn, but both are probabilities rather than guarantees, and either can break.
What Is Support and Resistance in the Stock Market?
In the stock market, the same idea applies to individual shares and to indices such as the Nifty 50 or BSE Sensex. Buyers tend to reappear at support and sellers at resistance, often around prior highs and lows or round-number levels. The same principles apply whether analysing the underlying market or a CFD based on that market.
How Do You Draw Support and Resistance Lines?
Start on a higher timeframe, such as the daily chart, and mark the clearest points where price turned sharply, using recent swing lows for support and swing highs for resistance. Draw these as zones a few points wide rather than single lines, since markets rarely reverse at an exact price. Adding trendlines, moving averages, or pivot levels that overlap the same area strengthens the case for a level.
How Do You Find Support and Resistance Levels?
The most common methods are prior swing highs and lows, trendlines, moving averages such as the 50-day and 200-day, Fibonacci retracements, and pivot points calculated from the previous session. Levels where several of these methods agree, known as confluence, tend to be the most reliable. It helps to check any level against how price has actually reacted there in the past.
What Is a Support and Resistance Indicator?
A support and resistance indicator is a charting tool that plots potential levels automatically, often using pivot-point maths or recent swing points. Common examples include pivot-point indicators and moving averages, which act as dynamic levels. These tools speed up the process, but they identify reference zones rather than predict outcomes, so many traders combine them with their own reading of the chart and other trading indicators.
RISK WARNING: CFDs are complex financial instruments and carry a high risk of losing money rapidly due to leverage. You should ensure you fully understand the risks involved and carefully consider whether you can afford to take the high risk of losing your money before trading.
Disclaimer: The information is provided for educational purposes only and doesn’t take into account your personal objectives, financial circumstances, or needs. It does not constitute investment advice. We encourage you to seek independent advice if necessary. The information has not been prepared in accordance with legal requirements designed to promote the independence of investment research. No representation or warranty is given as to the accuracy or completeness of any information contained within. This material may contain historical or past performance figures and should not be relied on. Furthermore estimates, forward-looking statements, and forecasts cannot be guaranteed. The information on this site and the products and services offered are not intended for distribution to any person in any country or jurisdiction where such distribution or use would be contrary to local law or regulation.
References
- “Clustering of Stock Prices – Operations Research (INFORMS)” https://pubsonline.informs.org/doi/10.1287/opre.13.2.258 Accessed 9 July 2026