Updated
A bull flag is one of the most recognisable bullish continuation patterns in technical analysis. It forms when a sharp rally (the flagpole) pauses in a short, slightly downward-sloping consolidation (the flag) before price potentially breaks higher and the uptrend resumes — a pause, not a key reversal.
The idea is simple: buyers push price sharply higher, the market briefly consolidates as early buyers take profit, and if momentum returns the trend continues. You’ll find the bull flag across forex CFDs (including pairs such as USD/INR), commodities, indices, and share CFDs, on any timeframe. Because it is usually read on a candlestick chart, it is also called the bull flag candlestick pattern.
This guide covers how to identify it, read its anatomy, set a measured target, and tell a real breakout from a false one.
Key Points
- A bull flag is a bullish continuation pattern — a sharp rally (the flagpole) followed by a short, slightly downward-sloping pause (the flag) that often precedes a further move higher rather than a reversal.
- The pattern is generally viewed as healthier when the flag retraces no more than about half of the flagpole and the breakout above the flag is supported by rising volume.
- A common way to gauge a potential target is the measured move — projecting the flagpole’s height from the breakout point — though this is illustrative only, and no pattern removes the risk of a false breakout.
What Is a Bull Flag Pattern?
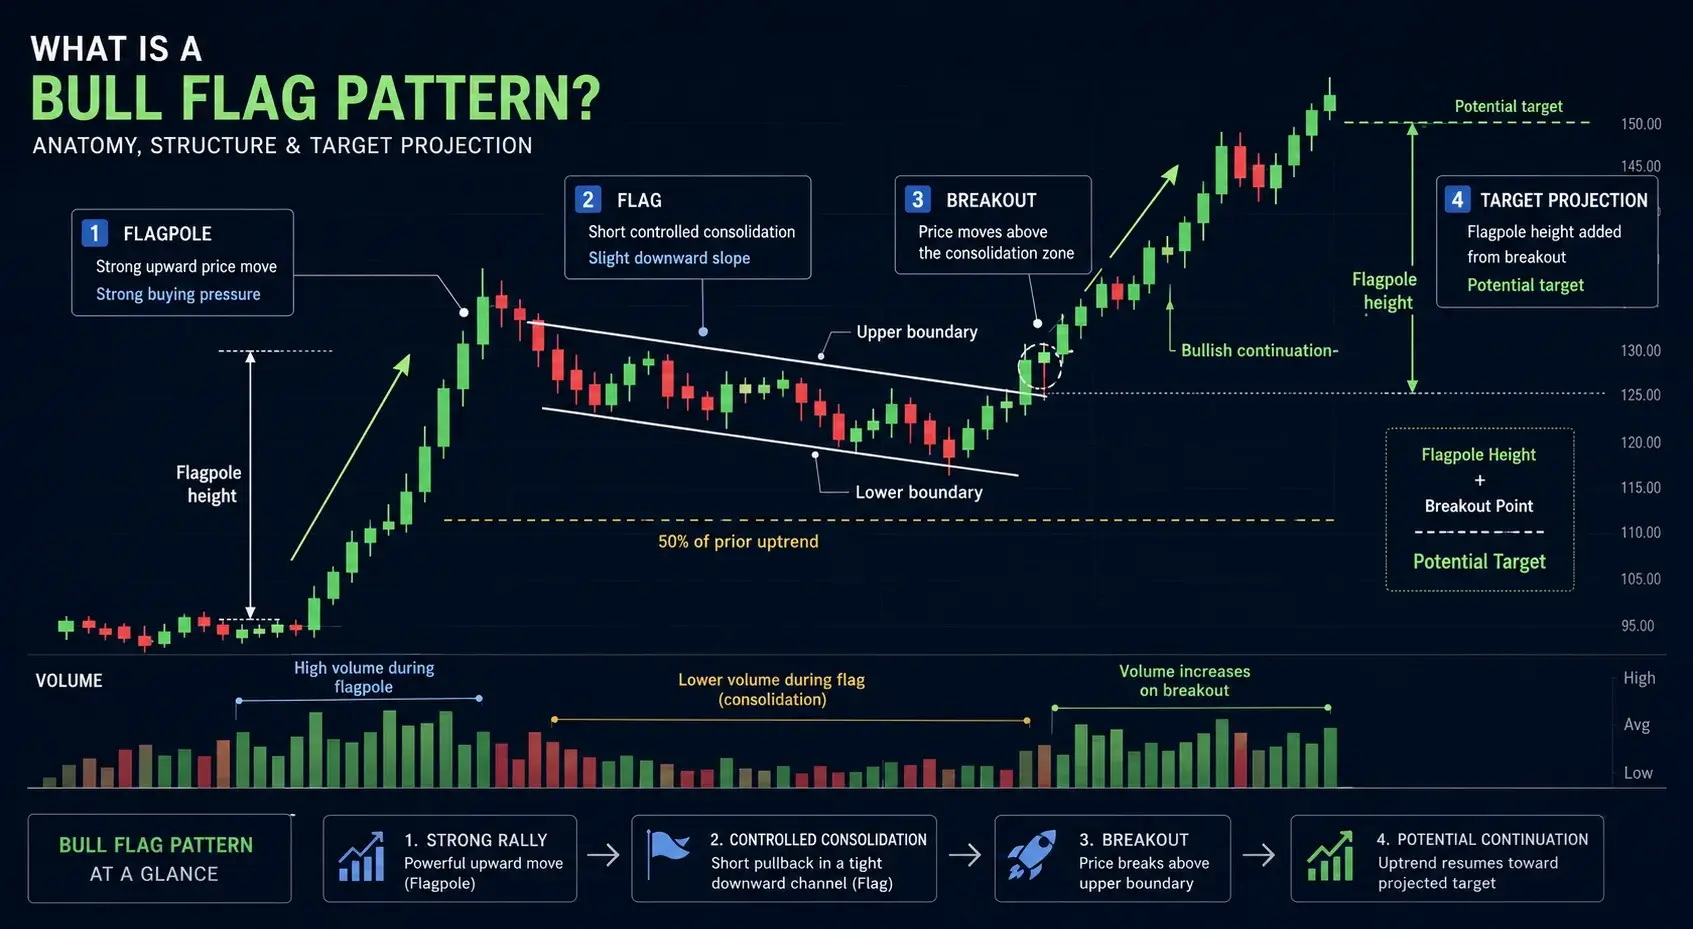
A bull flag is a bullish continuation pattern that forms when a strong upward price movement briefly pauses before potentially continuing higher. In technical analysis, a flag is described as a continuation pattern of tight consolidation that runs against the prevailing trend, according to Investopedia [1].
Here is the bull flag pattern explained:
- Flagpole: A steep, impulsive rally driven by strong buying pressure.
- Consolidation: Otherwise known as the ‘flag’, it is typically a short pullback or sideways channel that slopes slightly downward, and should not fall below 50% of the prior uptrend.
- Breakout: Price moves above the consolidation zone, forming the bull flag breakout pattern.
- Target projection: The height of the flagpole added to the breakout point to estimate where the move may extend.
The bull flag continuation pattern suggests that although price temporarily consolidates, buyers may still be in control. A breakout above the flag’s upper boundary is commonly discussed as a potential continuation structure, although outcomes can vary in practice.
Related Article: A Complete Guide to Supply and Demand: How to Use It
Bull Flag vs. Bear Flag: What’s the Difference?
While a bull flag signals potential continuation to the upside, its inverse — the bear flag — suggests possible continuation to the downside.
| Feature | Bull Flag | Bear Flag |
| Direction of Prior Move | Strong upward rally | Strong downward drop |
| Consolidation Angle | Slightly downward or sideways | Slightly upward or sideways |
| Breakout Direction | Upward | Downward |
| Market Implication | Possible trend continuation higher | Possible trend continuation lower |
Both patterns share the same structural logic — a sharp move, a controlled pause, and a breakout — but in opposite directions.
Bull Flag vs. Bull Trap: How to Tell Them Apart
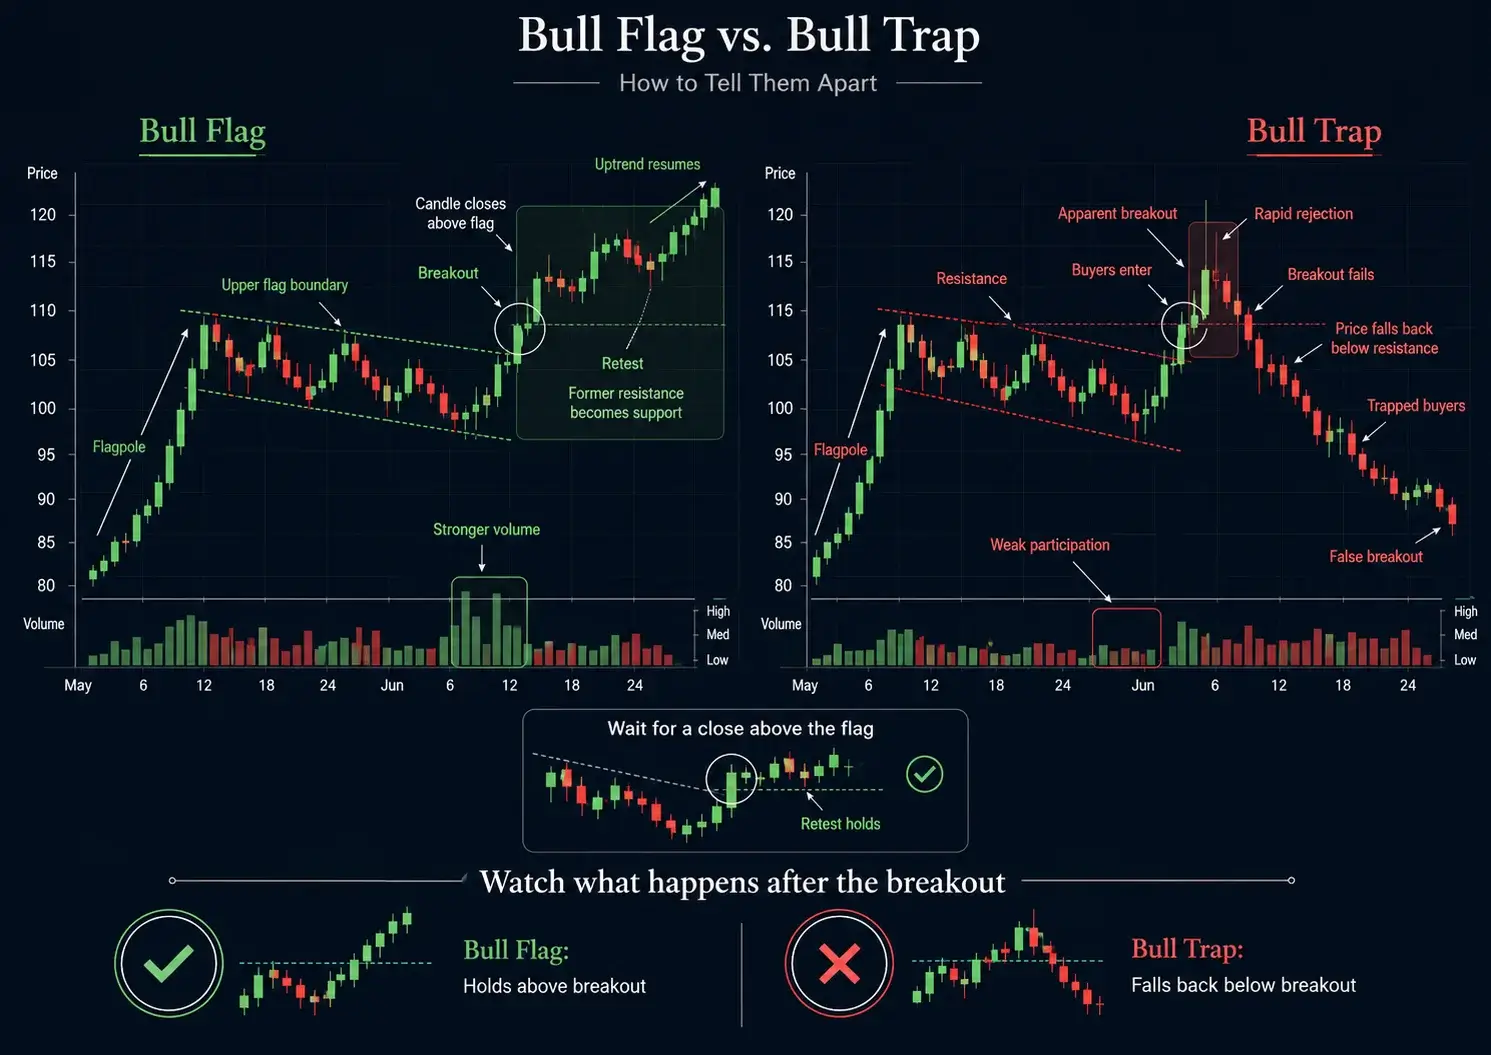
A bull trap is a false upside breakout: price pushes above a resistance level or the top of a flag, draws in buyers expecting continuation, then reverses lower and leaves them in losing positions. That is the opposite of a healthy bull flag, where the breakout holds and the prior uptrend resumes.
The two can look identical at the moment of breakout, which is what makes traps costly. The distinction usually emerges just after. A genuine bull flag breakout tends to hold above the flag’s upper boundary, often on firmer volume, while a bull trap fails to hold and slips back into or below the consolidation. Weak participation on the breakout, a rapid rejection at resistance, or a breakout that runs against the broader trend are all conditions more commonly associated with traps.
Because no confirmation method is foolproof, many traders wait for a candle to close above the flag — sometimes with a retest — before treating a breakout as valid.
Anatomy of the Bull Flag Chart Pattern
A bull flag candle pattern is more than a visual formation.
It reflects a moment where strong bullish momentum pauses, resets, and potentially resumes. Understanding why the structure forms is just as important as recognising how it looks on a bull flag pattern chart.
This pattern typically develops after buyers drive price sharply higher. Instead of reversing, the market pauses in a tight consolidation, showing that selling pressure is limited and that buyers may still be in control.
When price eventually breaks out of this consolidation, the bull flag breakout pattern signals a potential continuation of the existing trend.
5 Key Characteristics of the Bull Flag Pattern
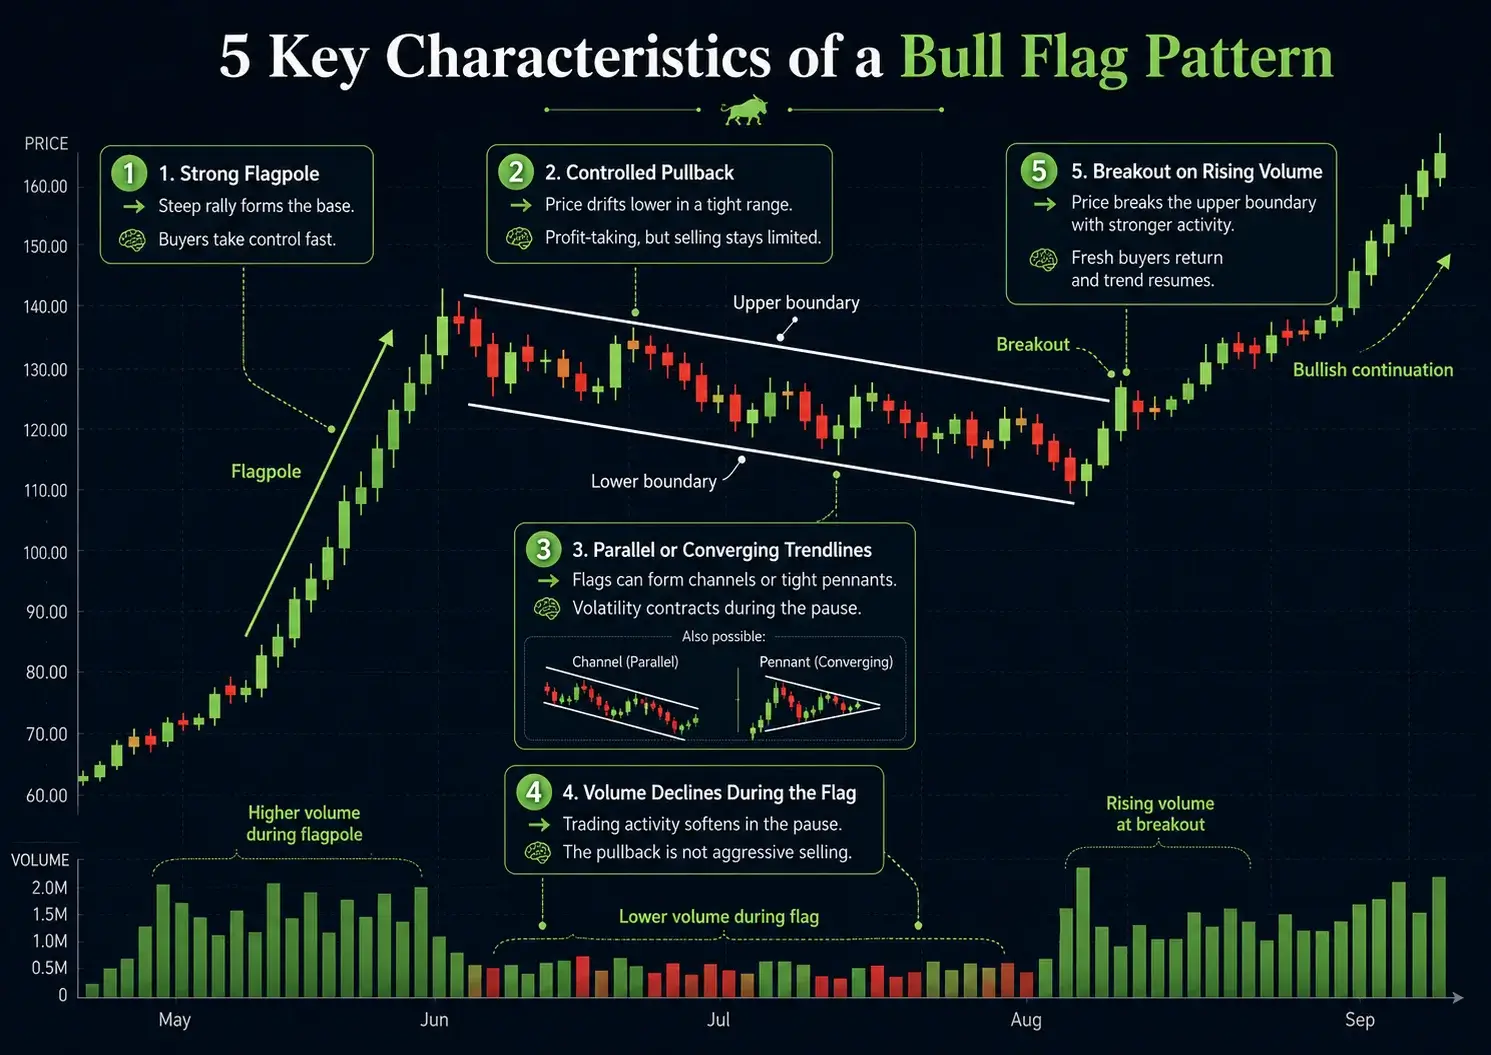
Here are the key structural traits traders look for when identifying a bull flag, along with the psychology behind them:
1. A Strong Flagpole
What It Is: A steep, fast rally that creates the foundation of the pattern.
Psychology: Buyers are in control, sentiment is strong, and momentum builds quickly as traders fear missing out on the move.
2. A Controlled Pullback (the Flag)
What It Is: Price drifts slightly downwards in a tight range.
Psychology: Early buyers take profits, but selling pressure is limited. The market pauses without showing clear signs of reversal.
3. Parallel or Converging Trendlines
What It Is: Depending on the variation, the consolidation becomes either a rectangular flag (parallel channel) or a triangular (pennant) flag — more on that in later sections.
Psychology: The market is balancing; lower volatility and shrinking ranges show both sides waiting for new information.
4. Volume Declines During the Flag
What It Is: Trading activity tends to soften as the flag develops.
Psychology: Momentum cools, but accumulation often quietly continues. A decline in volume shows the pullback is not driven by strong selling.
5. Breakout Supported by Rising Volume
What It Is: Price pushes above the flag’s resistance line, ideally with a volume increase.
Psychology: Fresh buyers re-enter, early shorts exit, and the previous trend regains control.
Related Article: The Basics of Support & Resistance
Bull Flag Pattern Examples: 3 Variations Traders Need to Know
In technical education, instructors often highlight that bull flag patterns can appear in different variations.
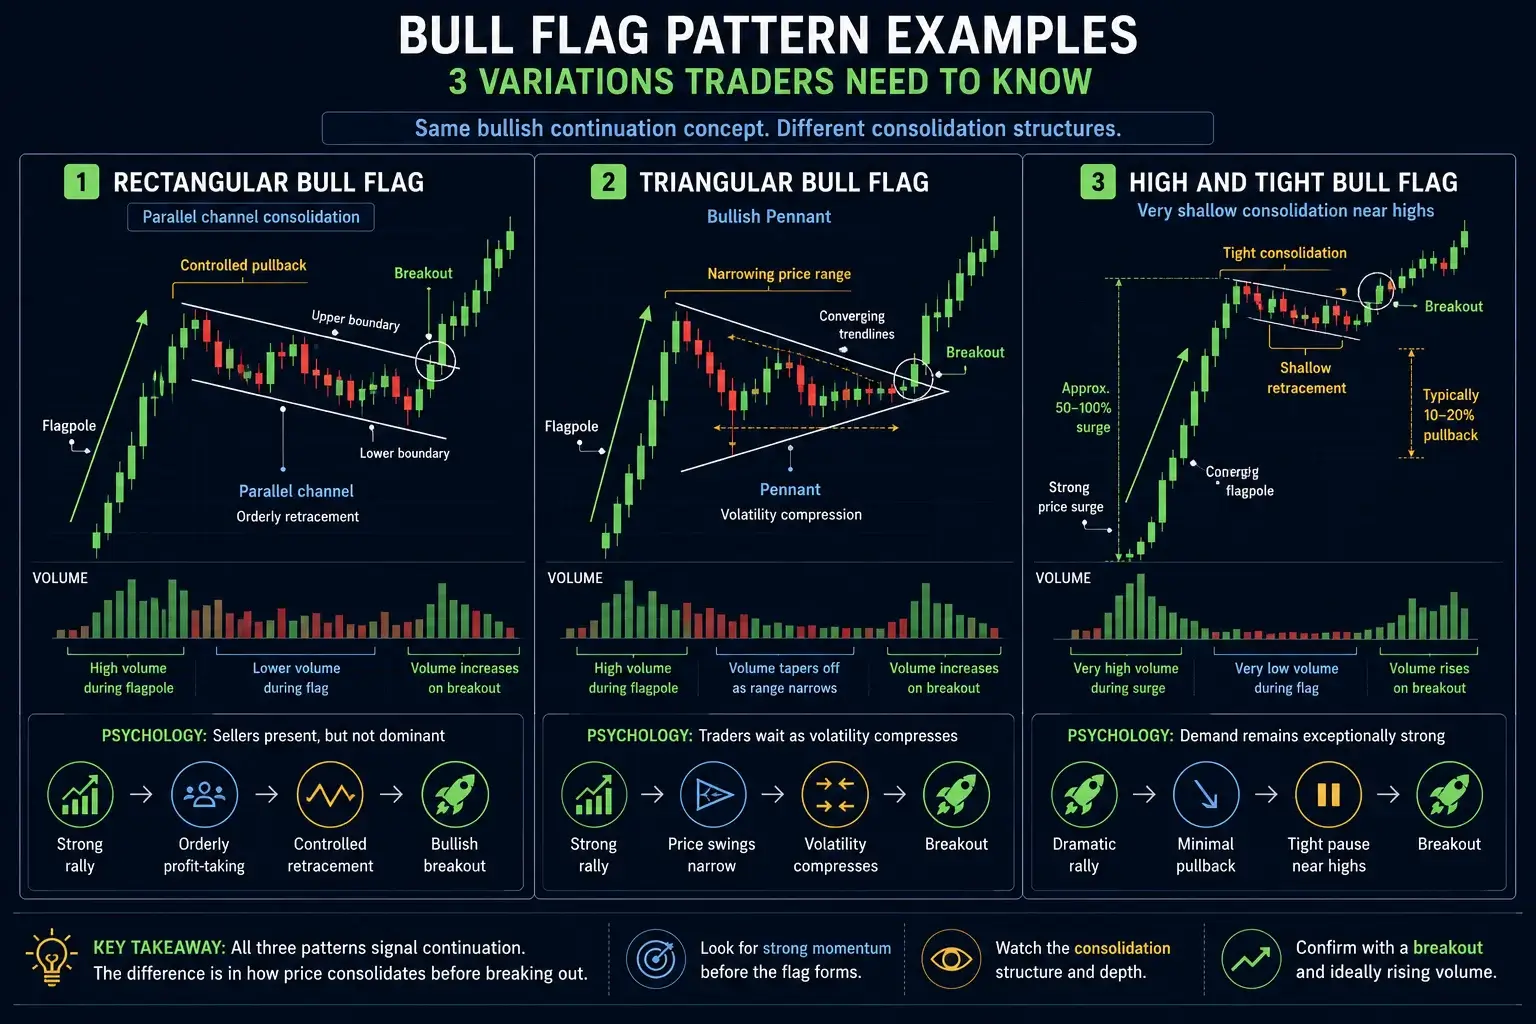
The underlying psychology remains the same, but the shape of the consolidation can differ based on volatility and market conditions. Here are the three most common variations:
1. Rectangular Bull Flag
Structure: A small, downward-sloping channel with parallel upper and lower boundaries.
Psychology: The market is digesting the prior rally in an orderly fashion. Sellers are present but not dominant, creating a mild, controlled retracement.
2. Triangular Bull Flag (Bullish Pennant)
Structure: Converging trendlines forming a small symmetrical triangle, otherwise known as a pennant.
Psychology: Volatility compresses as traders await a catalyst. This often precedes sharp bull flag breakout patterns because energy builds within a narrowing price range.
3. High and Tight Bull Flag
Structure: A steeper, more aggressive variant where the flagpole is unusually vertical due to a dramatic price surge (around 50% to 100%) and the flag is extremely shallow, with a brief retracement of typically 10–20%.
Psychology: Demand is so strong that sellers barely manage a pullback. The high and tight flag can appear in fast-moving markets like shares, but may be riskier due to the speed of the advance.
Using a Screener to Find Bull Flags Efficiently
Manually scanning charts can be time-consuming.
A practical approach is to use a market scanner or screener that filters instruments based on trend strength, volatility compression, or breakout conditions.
- Observe conditions where bull flag-like structures may appear,
- View how trend direction filters organise chart data,
- See how price consolidation areas are displayed, and
- Understand how potential breakout conditions are illustrated within the interface.
This helps demonstrate how such patterns may be presented across forex, commodities, and global share markets.
Valuable Insights on the Bull Flag
Besides the structural and psychological traits of the different bull flag chart patterns, here are some key insights that may help traders make more informed decisions:
Timeframe
Bull flags can appear on any timeframe, from one-minute charts to weekly charts, but their reliability often improves as the timeframe increases. On lower timeframes, price movements tend to be noisier, and sharp intraday volatility can distort the structure.
Bull flag pattern timeframes typically include:
- Intraday charts: anywhere from 15 minutes to several hours
- Daily charts: 3 days to 3 weeks, depending on volatility
- Weekly charts: multiple weeks or even months, especially in strong trending markets
What matters is not the absolute duration, but that the flag forms as a controlled pause in the trend. A flag that drags on too long may lose its continuation potential, while one that is too short may signal a shallow pullback rather than a meaningful consolidation.
The key is that the market shows temporary equilibrium — a brief period where buyers pause, sellers test the downside, and neither side overwhelms the other. When buyers reassert control, the pattern often breaks out.
Interpreting the Slope
The slope of the consolidation tells an important story about market psychology:
1. Slight Downward Slope (Most Common)
A gentle downward channel is the classic bull flag candle pattern. This slope reflects:
- Profit-taking from early buyers
- A controlled, orderly pullback
- Sellers testing momentum but failing to reverse the trend
Many traders perceive the slight downward slope as the most structurally healthy variation of the bull flag chart pattern.
2. Sideways Slope (Neutral Flag)
Some bull flags also consolidate horizontally, forming a tight band. This reflects:
- Balanced buying and selling
- Strong underlying trend momentum
- A market waiting for new information before committing
Sideways flags often precede sharp breakouts because energy is compressed within the range.
How Accurate Are Bull Flags?
The bull flag chart pattern can be a useful continuation structure. But like all technical patterns, its reliability depends on market context, trend strength, liquidity, and how well the formation develops. As such, traders often treat the bull flag as an analytical tool best used alongside other complementary technical indicators and proper risk management.
4 Advantages of the Bull Flag Chart Pattern
When assessed carefully and used alongside broader market analysis, the bull flag pattern can offer several practical benefits. These help explain why the structure is widely recognised in technical analysis, especially during strong trending conditions.
1. Clear Trend Continuation Structure
Bull flags can appear after a strong, impulsive advance. This structure is frequently referenced in educational materials for illustrating trend continuation concepts, helping to visualise where buyers may be regrouping after an initial push.
2. Defined Entry and Risk Areas
The chart pattern naturally creates a breakout level (the top of the flag) and a logical risk zone (just below the flag’s lower boundary). This can help clarify how technical analysts map hypothetical risk and reward zones in a theoretical learning context.
3. Works Across Markets
The bull flag follows the same structural logic across share CFDs, index CFDs (such as those tracking the Nifty 50 or BSE Sensex), commodities like gold, and forex: strong move → pause → breakout. Because index CFDs such as those tracking the Nifty 50 or BSE Sensex trade on defined session hours, the same flag can look cleaner on a daily chart than on a noisy intraday one.
4. Volume Can Add Context
While not an absolute requirement, increasing volume during the breakout can help validate that buyers are stepping back in after consolidation. This may add context in environments where liquidity is stable.
4 Risks of the Bull Flag Chart Pattern
Despite its strengths, the bull flag pattern is not foolproof. Market volatility, weak participation, or structural imperfections can reduce its reliability. Understanding these limitations helps readers interpret the pattern more realistically.
1. False Breakouts
The most common risk is a false breakout, where price moves above the flag briefly but lacks the follow-through to sustain the trend. This can happen during low-liquidity periods, news-driven volatility, or when momentum is fading.
2. Pattern Misidentification
Not every pullback after a rally is a bull flag. Overly deep retracements, wide or erratic consolidation, or sharp V-shaped reactions can create lookalikes that do not behave like true continuation patterns.
3. Timeframe Distortion
On lower timeframes, price action is more prone to noise. This can make the bull flag breakout pattern less reliable, as micro-volatility may distort structure or trigger premature entries.
4. Market Conditions Matter
Choppy or directionless environments often fail to support continuation. The pattern is generally less effective when:
- Liquidity is thin
- Volatility is unusually high
- Broader market sentiment contradicts the prior trend
Even a well-formed bull flag can fail if the larger environment shifts suddenly.
Look Out for These Warning Signs of Bull Flag Failures
Certain behaviours within the price structure can signal that a bull flag is weakening or at risk of failing. These warning signs can help traders differentiate between healthy consolidations and patterns that may not follow through.
1. Deep or Extended Consolidation
Flag retracements that dig too far into the flagpole (typically more than 50%) — or consolidation that lasts disproportionately long — often signal fading trend strength rather than a healthy pause.
2. Breakout With Weak Participation
A breakout on noticeably weak volume (in liquid markets) or low volatility may reflect hesitation among buyers. This could increase the probability of a quick reversal or range re-entry.
3. Failure to Hold Above Breakout Level
If price breaks out but cannot stay above the flag’s upper boundary — especially after a retest — the pattern may lose validity. Repeated failed attempts to clear resistance often indicate a shift in control from buyers to sellers.
4. Broader Trend Weakness
If the bull flag forms late in an extended trend or during a period of weakening momentum, the continuation thesis becomes less reliable. Divergences in momentum indicators or slowing volatility regimes can be early clues.
Using a Bull Flag Pattern: A Step-by-Step Guide
Using the bull flag candlestick pattern effectively involves more than spotting the shape on a chart.
Traders typically build a structured process around entry timing, target setting, exit planning, and confirming the setup with other technical tools. The goal is not to predict outcomes with certainty, but to approach the pattern in a consistent, risk-managed way.
1. Prepare an Entry Checklist
In educational settings, market analysts often review whether the structure meets commonly referenced bull flag characteristics:
- Strong flagpole: a clear upward move with expanding volume.
- Orderly consolidation: a tight downward-sloping or sideways channel with controlled pullbacks.
- Well-defined resistance: an upper boundary for the flag where the breakout level becomes obvious.
- Volume context: often lighter during consolidation and stronger on the breakout.
- Timeframe alignment: bull flags tend to show up more clearly on higher timeframes, where noise is reduced.
Liquidity also matters for confirmation: participation on major instruments tends to be deepest around the London–New York overlap, roughly 5:30 PM to 9:30 PM IST, and breakouts formed in thinner periods can be less dependable.
Once the structure meets key bull flag criteria, examples of potential entry approaches include:
- Illustrative aggressive entry: hypothetical purchase if price breaks the flag’s upper trendline.
- Illustrative conservative entry: hypothetical waiting for a breakout above resistance and a possible retest.
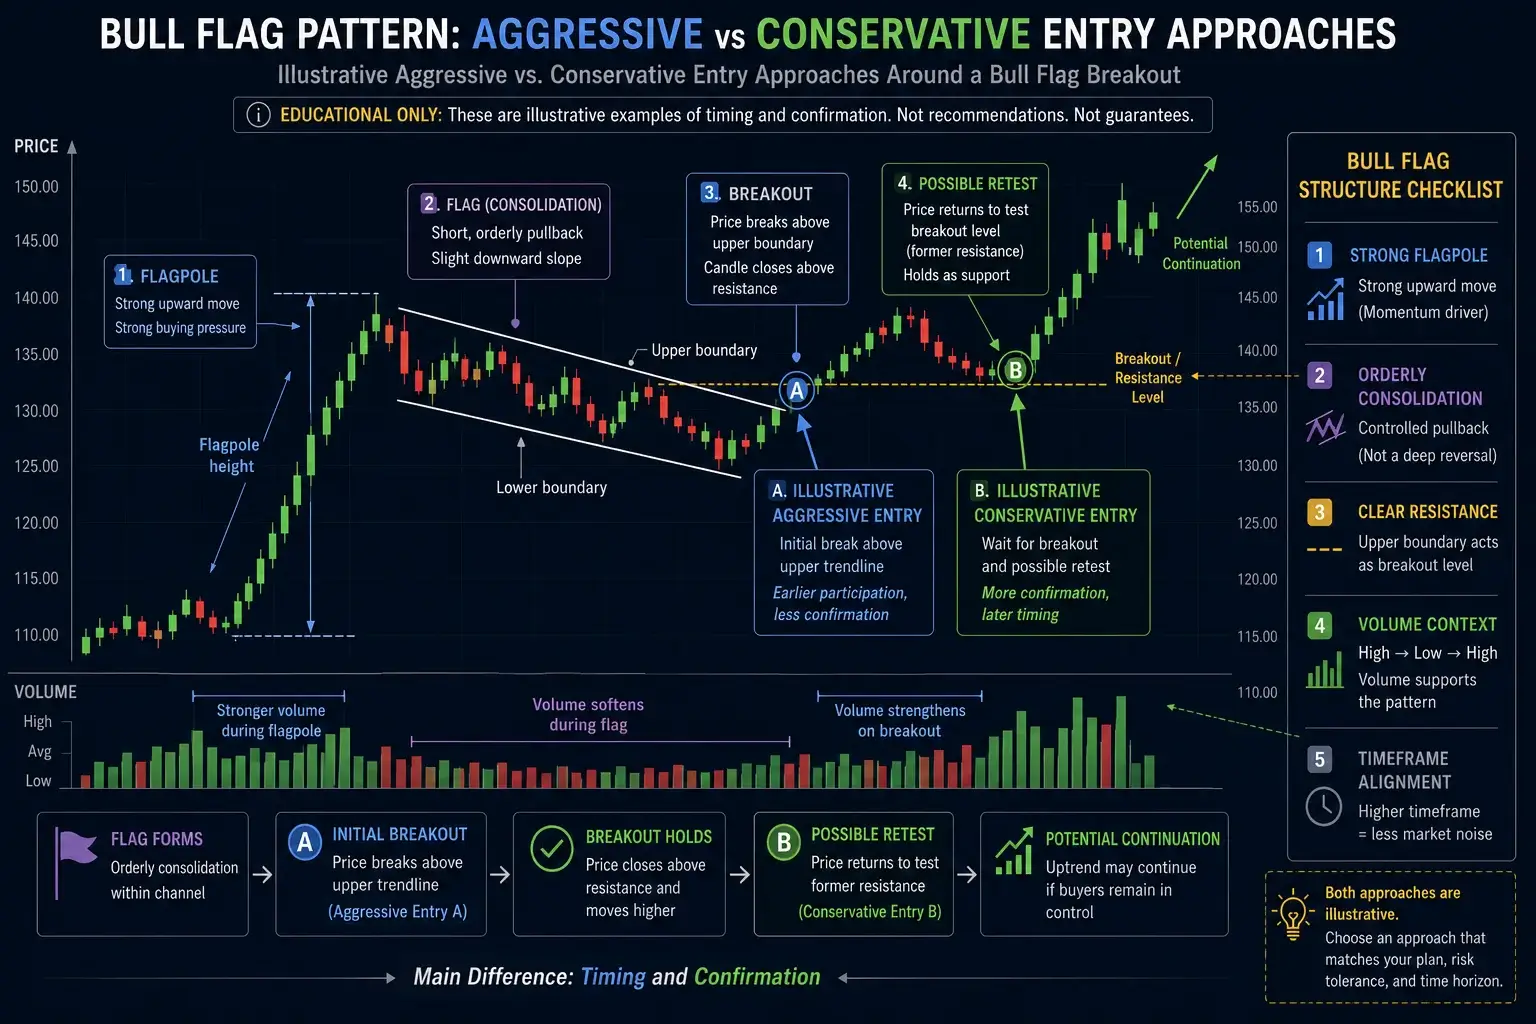
These examples are for educational purposes only and are not trading recommendations. This example is hypothetical and for illustrative purposes only. It does not reflect actual trading results or client experiences.
2. Set Target Price
The most common way to estimate a bull flag target is the measured move: measure the vertical height of the flagpole and project that same distance upward from the breakout point. In educational charting examples, instructors demonstrate this for illustration only.
This projected target zone is purely hypothetical and does not predict future price movements or serve as trading advice. This example is hypothetical and for illustrative purposes only.
Depending on the timeframe and prevailing market conditions, traders may:
- Scale out of positions at partial levels
- Use multiple target tiers
- Extend targets in strong momentum environments
- Reduce targets during slower market phases
Targets are guides, not guarantees, and should be considered alongside broader market context.
3. Plan an Exit Strategy
Exit planning is important, especially in fast breakouts. Educational examples of exit approaches often discussed in technical analysis include:
- Hypothetical stop-loss: placing a stop below the consolidation low as an illustrative concept.
- Illustrative trailing stops: showing how positions might be adjusted to manage risk.
- Theoretical partial profit-taking: demonstrating risk-management techniques.
- Time-based exits: used in theory to close positions within a session.
A well-defined exit can help reduce emotional decisions, especially when price accelerates quickly after the breakout. These risk-management concepts are shown in educational examples to illustrate how technical analysis maps exits — they are not recommendations and may not be suitable for real market conditions.
4. Pair With Other Technical Analysis Tools
Combining the bull flag with additional analytical tools can help filter setups:
- Moving averages: to confirm the prevailing trend
- Momentum indicators (e.g., RSI, MACD): to identify strength or divergence
- Volume profile: to understand where participation is concentrated
- Support/resistance mapping: to check the breakout is not heading directly into a strong ceiling
- Multiple timeframe analysis: to confirm the flag aligns with broader trend behaviour
Integrating the bull flag with other forms of analysis does not guarantee outcomes, but it can offer a more complete view and reduce reliance on a single chart pattern.
Reading Momentum, Not Predicting It
Learning to read the bull flag goes beyond spotting shapes.
It involves interpreting the psychology behind the pullback, assessing the quality of the trend, and using a checklist that includes structure, breakout level, timeframe, and broader market context.
While no pattern is flawless, the bull flag can help traders identify potential continuation setups across markets — from forex to commodities, indices to share CFDs — especially during strong trending environments.
Ultimately, the bull flag is best treated as a structured way to read momentum: a framework for identifying where a trend may pause and resume, always paired with defined risk, realistic targets, and confirmation rather than certainty. No chart pattern removes the risk of loss, and continuation is never guaranteed.
Frequently Asked Questions
What is a bull flag in trading?
A bull flag is a bullish continuation pattern made up of a sharp rally (the flagpole) followed by a short, slightly downward or sideways consolidation (the flag). It suggests an uptrend has paused rather than reversed, and that momentum may resume if price breaks above the flag. Like any chart pattern, it describes a probability, not a certainty — outcomes vary with market conditions.
What does a bull flag look like on a chart?
On a chart, a bull flag looks like a steep, near-vertical price move followed by a tilted rectangular or gently descending channel that drifts against the trend. Volume typically expands on the flagpole and eases during the flag. The pattern is only considered complete once price closes above the flag’s upper boundary.
What is the usual breakout direction of a bull flag?
A bull flag most often breaks out to the upside, in the same direction as the prior rally, which is why it is classed as a continuation rather than a reversal pattern. The breakout is generally seen as more reliable when accompanied by a pick-up in volume. A break below the flag instead can signal that the expected continuation has failed.
How do you set a price target on a bull flag pattern?
A common educational method is the measured move: take the height of the flagpole and project that same distance upward from the breakout point to estimate a potential target zone. This projection is illustrative only and does not predict where price will actually go. Many traders also scale targets to prevailing volatility and broader market context. This example is hypothetical and for illustrative purposes only.
When is a bull flag pattern considered invalidated?
A bull flag is often considered invalidated when the consolidation retraces more than about half of the flagpole, when the pause drags on far longer than a normal continuation, or when price breaks below the flag’s lower boundary instead of above the upper one. A breakout that cannot hold above the flag — especially after a retest — is another common sign the pattern has failed. These are general guidelines rather than fixed rules.
What is the difference between a bull flag and a bull trap?
A bull flag is a continuation pattern where price pauses and then tends to resume its uptrend, while a bull trap is a false breakout that lures buyers in before price reverses lower. The difference usually shows up at the breakout: a genuine bull flag breakout tends to hold above resistance on firmer volume, whereas a bull trap fails to hold and quickly falls back into or below the range. Confirmation, such as a candle close above the flag on stronger participation, is commonly used to reduce the risk of being caught in a trap.
Does after-hours trading affect bull flag reliability?
Thinner liquidity outside main trading hours can make breakouts and consolidations look cleaner on the chart than they are, so signals formed in low-volume periods may be less dependable. Many traders give more weight to patterns that develop and break during active sessions, such as the London–New York overlap. Confirming a breakout once fuller liquidity returns is one way some traders manage this risk.
References
- “Understanding Flag Patterns in Technical Analysis – Investopedia” https://www.investopedia.com/terms/f/flag.asp Accessed 13 July 2026