[DAILY TRADING] Coherent Corp Stock 20 Aug 2026 – COHR Slides 19% as Insiders Sell, Short ETF Debuts
 Updated Updated Thu, 2026 August 20 10:10
![[DAILY TRADING] Coherent Corp Stock 20 Aug 2026 – COHR Slides 19% as Insiders Sell, Short ETF Debuts](https://www.vantagemarkets.co.id/en/wp-content/uploads/sites/22/2026/08/cohr-stock-20-august-2026-featured.webp)
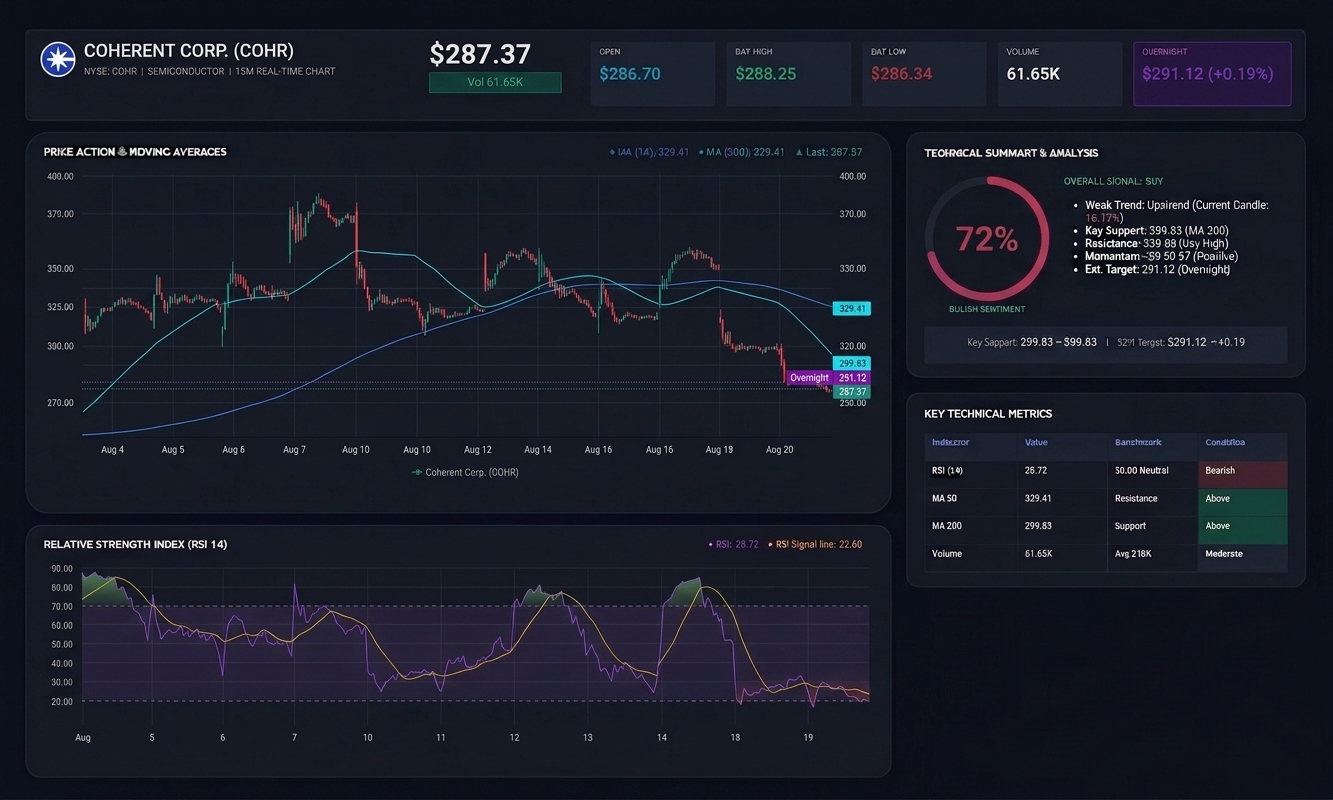
Coherent (COHR) shares fell 19% over the week to 19 August 2026, trading near $287.37 as of the 20 August cut-off, even as Q4 revenue rose 42% to $2.05 billion. RSI sits at 28.72, oversold, with price below both the 50-period (299.83) and 200-period (329.41) moving averages.
As of 02:24 UTC (10:24 GMT+8) on 20 August 2026, Coherent Corp (NYSE: COHR) traded at $287.37, up 0.19% on the 15-minute chart. It is the calm after a genuinely wild fortnight for anyone tracking the COHR stock price today: a stock that beat earnings by a wide margin and still fell off a cliff.
Coherent’s fourth-quarter numbers were excellent: revenue up 42%, non-GAAP earnings per share nearly doubled. Yet the COHR share price has dropped 19.2% over the past week regardless, according to GuruFocus [4]. That gap is the story of this piece, worth understanding before searching for a COHR stock forecast, because there isn’t one here, only the levels and dates the chart is pointing to.
Key Points
- COHR sits below both its 50-period (299.83) and 200-period (329.41) moving averages on the 15-minute chart.
- RSI reads 28.72, oversold territory, with its moving average at 22.60, based on the TradingView setup used for this analysis.
- Fiscal Q4 revenue climbed 42% to $2.05 billion and EPS nearly doubled to $1.74, yet Coherent stock has still fallen sharply since the print.
The Chart: COHR Ticker Stuck Below Its Own Averages
The 15-minute chart opened at $286.70, ran to a high of $288.25, dipped to $286.34, and settled at $287.37 on 61.65 thousand shares for that final bar, based on the TradingView setup used for this analysis. Nothing dramatic there. The drama happened days earlier.
Two rallies climbed and collapsed inside this chart’s window. The first peaked near 7 August, when Coherent closed at $379.13 according to one market tracker [5]. Earnings landed on 12 August, and a second rally followed, topping out near $360 around 17 and 18 August before a sharp, red-candle slide on heavy volume.
Price now sits under both moving averages, a bearish setup: COHR would need to reclaim its 50-period MA at 299.83 before the short-term trend reads as anything but down, with the 200-period MA at 329.41 a bigger test further out. RSI above its own average from a beaten-down base is often an early tell that selling is losing steam, though not, on its own, a reason to act.
| Metric | Level | Reading |
| Last price (20 Aug cut-off) | $287.37 | Consolidating |
| 50-period MA | 299.83 | Resistance overhead |
| 200-period MA | 329.41 | Resistance overhead |
| RSI (14) | 28.72 | Oversold |
| RSI moving average | 22.60 | Oversold |
| One-week change | -19.2% | Sharp reversal |
| Q4 FY26 revenue growth | +42% YoY | Beat, ignored by the tape |
Table 1: COHR chart and earnings snapshot as of 20 August 2026. Source: TradingView setup used for this analysis and cited company results.
What’s Actually Behind the COHR Stock News This Month
Coherent’s fourth-quarter results, out 12 August, showed $2.05 billion in revenue, up 42% on a pro forma basis, with Datacenter and Communications growing 59%. Non-GAAP EPS hit $1.74, and gross margin expanded to 40.2% [1].
The stock initially cheered the print. By Monday 17 August, COHR was up 9.34% on the day as several banks lifted valuations into the low $400s, with market commentary pointing to continued digestion of the 12 August results and news that semiconductor clients had begun sampling Coherent’s new 300mm silicon carbide substrates [7][3]. JPMorgan had already lifted its valuation to $435 days earlier, keeping Overweight [8], while Bank of America’s Vivek Arya was cooler that same day, holding at Hold with a $400 fair-value view on valuation and margin grounds despite strong execution [6]. Two desks, two temperatures, same print. Some of Monday’s gain pared back overnight into Tuesday [3].
Then the mood soured fast. A new inverse-leveraged fund, the Tradr 2X Short COHR Daily ETF (Cboe: COHQ), began trading 18 August, and reports flagged Coherent insiders as net sellers for three straight months with no buying to offset it [2]. Add earlier chatter about a possible US review of Chinese optical-transceiver imports, still unresolved as of 20 August [5], and you get a stock searching for a reason to hold its post-earnings gains.
Levels and Dates Worth Watching
- 50-period MA, ongoing: 299.83 is the nearest hurdle above the current COHR share price.
- 200-period MA, ongoing: 329.41 lines up close to pre-earnings levels and is the bigger test further out.
- RSI oversold zone, ongoing: both 28.72 and its 22.60 average sit under 30.
- US optical-transceiver review, no confirmed date: any headline here moves the whole photonics group, not just Coherent corp stock [5].
- Next earnings, date to be confirmed: fiscal Q1 2027 is the next scheduled catalyst.
Risk Considerations for COHR Share CFD Traders
A stock swinging 19% in a week, on top of a genuine earnings beat, widens short-term volatility across the individual share CFD and the broader photonics trade. None of the above is a signal to take a position in Coherent or anything nearby; it reflects what the chart and cited sources show as of this cut-off.
A Stop Loss order is one way to manage exposure to a stock moving this much. It will not stop a loss from happening, but it can help cap one at a size a trader has already chosen.
Leverage cuts both ways: it can magnify a good move as easily as a bad one, and none of Coherent’s chart or news changes that. Position sizing tied to account equity, not to any level in this piece, remains the habit that matters most heading into another earnings date. More: share CFDs, COHR earnings news, NVIDIA coverage, Nasdaq news, S&P 500 news and risk management on Vantage Markets.
RISK WARNING: CFDs are complex financial instruments and carry a high risk of losing money rapidly due to leverage. You should ensure you fully understand the risks involved and carefully consider whether you can afford to take the high risk of losing your money before trading.
Disclaimer: The information is provided for educational purposes only and doesn’t take into account your personal objectives, financial circumstances, or needs. It does not constitute investment advice. We encourage you to seek independent advice if necessary. The information has not been prepared in accordance with legal requirements designed to promote the independence of investment research. No representation or warranty is given as to the accuracy or completeness of any information contained within. This material may contain historical or past performance figures and should not be relied on. Furthermore estimates, forward-looking statements, and forecasts cannot be guaranteed. The information on this site and the products and services offered are not intended for distribution to any person in any country or jurisdiction where such distribution or use would be contrary to local law or regulation.
References
[1] “Coherent Corp. Reports Fourth Quarter and Full Year Fiscal 2026 Results – SEC EDGAR / GlobeNewswire” https://www.sec.gov/Archives/edgar/data/0000820318/000119312526346860/d128030dex992.htm Accessed on 20 August 2026.
[2] “Why is Coherent stock sliding today? – Investing.com” https://www.investing.com/news/stock-market-news/why-is-coherent-stock-sliding-today-93CH-4865543 Accessed on 20 August 2026.
[3] “COHR Stock Pulls Back After Thermal Innovation-Led Rally – Yahoo Finance” https://finance.yahoo.com/markets/stocks/articles/cohr-stock-pulls-back-thermal-072119977.html Accessed on 20 August 2026.
[4] “Coherent Corp (COHR) Stock Down 6.2% but Still Overvalued – GuruFocus” https://www.gurufocus.com/news/9044068 Accessed on 20 August 2026.
[5] “Why Coherent Corp (COHR) Stock Is Up +16.8% in the Last 30 Days – Tickeron” https://tickeron.com/ticker/COHR/ Accessed on 20 August 2026.
[6] “COHR Stock Quote Price and Forecast – CNN” https://www.cnn.com/markets/stocks/COHR Accessed on 20 August 2026.
[7] “Coherent Corp. Stock Jumps As Wall Street Lifts Price Targets – Timothy Sykes” https://www.timothysykes.com/news/coherent-corp-cohr-news-2026_08_17/ Accessed on 20 August 2026.
[8] “Coherent Corp. Draws Bullish Targets As COHR Volatility Spikes – Timothy Sykes” https://www.timothysykes.com/news/coherent-corp-cohr-news-2026_08_04-2/ Accessed on 20 August 2026.