[DAILY TRADING]: NAS100 Analysis 18 August 2026 — Nasdaq 100 Slips Below 30,000 as RSI Hits 23.96
 Updated Updated Tue, 2026 August 18 09:23
![[DAILY TRADING]: NAS100 Analysis 18 August 2026 — Nasdaq 100 Slips Below 30,000 as RSI Hits 23.96](https://www.vantagemarkets.co.id/en/wp-content/uploads/sites/22/2026/08/NAS100-Daily-Analysis-August-11-2026.webp)
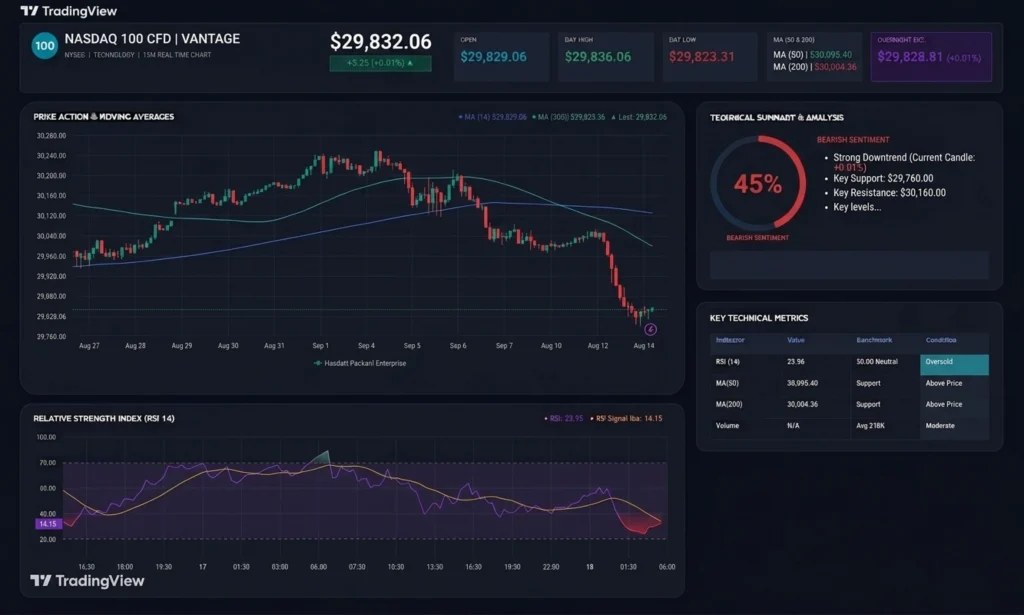
Quick gut-check for anyone glancing at Nasdaq today: NAS100 traded at 29,832.06 as of 10:08 (SGT, GMT+8) on 18 August 2026, up 3.25 points on the last completed 15-minute candle, per the TradingView setup used for this analysis. That barely-there bounce followed two rough sessions that knocked the Nasdaq price roughly 450 points off Monday’s high. For anyone watching the Nasdaq index today, the story is less about one green candle and more about the week ahead.
It’s not a quiet backdrop. Home Depot (HD) posts second-quarter earnings before Tuesday’s bell, the first real read on US consumer spending since Friday’s soft retail sales print, with Target (TGT), Lowe’s (LOW) and Walmart (WMT) close behind. 1,2 Wednesday brings minutes from the Federal Reserve’s 28-29 July meeting, watched closely since three officials dissented in favour of a rate hike. 3 All levels below are as of the stated cut-off unless flagged otherwise.
Nasdaq Chart Today: What the NAS100 Chart Is Showing
The Nasdaq index chart tells a fairly simple story once you strip out the noise. Price climbed toward an intraday high near 30,280 during Monday’s session, then reversed hard, slicing through the 50-period and 200-period moving averages on the way to a Tuesday low near 29,760. Worth remembering: this NAS100 chart tracks the Nasdaq 100 index specifically, not the broader Nasdaq Composite index, which closed 0.32% lower at 26,644.91 on Monday.6
The 50-period moving average sits at 30,095.40 and the 200-period at 30,004.36, both now above spot, flipping their usual role as support into potential resistance. The RSI reads 23.96, with its signal average at 25.15, deep in oversold territory on the same setup. That’s a description of exhausted selling, not a promise of a bounce.
Nasdaq News Today: What’s Driving the Index Lower
The Nasdaq stock market today is wrestling with more than one storyline. US stocks fell Monday as oil and Treasury yields rose on renewed Middle East tensions, after a memorandum of understanding between the US and Iran lapsed; Brent crude touched $90 a barrel.4 The S&P 500 fell 0.52% and the Dow slipped 0.51% that session, while the 10-year Treasury yield climbed to 4.68%. 5,6
Rate expectations pull in the same direction. Three Fed officials, Beth Hammack, Neel Kashkari and Lorie Logan, dissented at the July meeting in favour of a hike, and Wednesday’s minutes should show how far that view spread across the committee. 3 Capital.com’s Kyle Rodda pegged the odds of a September rate hike at roughly one in three, a number shifting with each new data print. 1
Retail earnings add a third thread: Home Depot today, Target and Lowe’s Wednesday, Walmart Thursday, each a read on US household spending after last week’s sales miss. 1,2 None of this hands the Nasdaq market index one tidy narrative. It’s several stories, rates, consumers, geopolitics, landing in the same week.
Nasdaq 100 Key Levels Traders Are Watching
| Instrument | Support | Resistance | What’s Happening |
| NAS100 | 29,760 (Tuesday low) / 30,004.36 (200-period MA) | 30,095.40 (50-period MA) / 30,280 area (prior swing high) | Price sits below both moving averages after a two-session decline; RSI is oversold on the same setup. |
Reference levels only. Not trade signals. Source: the TradingView setup used for this analysis, accessed 10:08 (SGT, GMT+8), 18 August 2026.
What to Watch Next for Nasdaq 100 Today
- Home Depot Earnings, 18 August: First retail print since the sales miss.
- FOMC Minutes, 19 August: Shows how far the dissent spread.
- Target and Lowe’s Earnings, 19 August: More on consumer spending.
- Walmart Earnings, 20 August: The week’s broadest bellwether.
- Jackson Hole Symposium, 27-29 August: Fed Chair Kevin Warsh’s first keynote, Friday 28 August.3
Managing Risk on the Nasdaq Index
A pullback this size, with an oversold RSI on top, is a fair reminder that Nasdaq 100 today can move quicker than one day’s headlines suggest. A Stop Loss order is one tool traders use to fix, in advance, the exposure they’re willing to carry on a position instead of leaving it open-ended.
Trading index CFDs with leverage, such as Vantage’s maximum of 1:1000, amplifies both potential returns and potential losses relative to the capital committed, so position sizing deserves real care around sessions like this one. Traders following the Vantage NAS100 CFD can browse the latest NAS100 news and Nasdaq news today, alongside Federal Reserve news and earnings news today for the wider calendar. For risk mechanics, see the definitions of leverage, Stop Loss and RSI, or browse Vantage’s risk management coverage and the S&P 500 news tag for the AI-linked tech theme alongside it.
RISK WARNING: CFDs are complex financial instruments and carry a high risk of losing money rapidly due to leverage. You should ensure you fully understand the risks involved and carefully consider whether you can afford to take the high risk of losing your money before trading.
Disclaimer: The information is provided for educational purposes only and doesn’t take into account your personal objectives, financial circumstances, or needs. It does not constitute investment advice. We encourage you to seek independent advice if necessary. The information has not been prepared in accordance with legal requirements designed to promote the independence of investment research. No representation or warranty is given as to the accuracy or completeness of any information contained within. This material may contain historical or past performance figures and should not be relied on. Furthermore estimates, forward-looking statements, and forecasts cannot be guaranteed. The information on this site and the products and services offered are not intended for distribution to any person in any country or jurisdiction where such distribution or use would be contrary to local law or regulation.
References
[1] “Stock Market Today (Aug. 17, 2026): Dow, S&P 500 fall as retail earnings reports loom” – TheStreet https://www.thestreet.com/stock-market-today/stock-market-today-dow-jones-sp-500-nasdaq-updates-aug-17-2026 Accessed on 18 August 2026.
[2] “Stock market today: Live updates” – CNBC https://www.cnbc.com/2026/08/17/stock-market-today-live-updates.html Accessed on 18 August 2026.
[3] “Week Ahead, 17-21 August 2026: FOMC Minutes, A Retail-Earnings Wave, And Reddit’s S&P 500 Debut Headline A Data-Light US Week Ahead Of Warsh’s Jackson Hole Test” – Capital Street FX https://www.capitalstreetfx.com/market-analysis/week-ahead-1721-august-2026-fomc-minutes/ Accessed on 18 August 2026.
[4] “Stock market today: Dow, S&P 500, Nasdaq fall as oil rises amid US-Iran tensions, 30-year yield hits highest level in decades” – Yahoo Finance https://finance.yahoo.com/markets/live/stock-market-today-monday-august-17-dow-sp-500-nasdaq-oil-treasurys-094421171.html Accessed on 18 August 2026.
[5] “Stock Market Today, Aug. 17: Markets Inch Lower and Treasury Yields Rise as Investors Wait for Retail Earnings” – The Motley Fool https://www.fool.com/coverage/stock-market-today/2026/08/17/stock-market-today-aug-17-markets-inch-lower-and-treasury-yields-rise-as-investors-wait-for-retail-earnings/ Accessed on 18 August 2026.
[6] “Stock market news for Aug. 17, 2026” – CNBC https://www.cnbc.com/2026/08/16/stock-market-today-live-updates-.html Accessed on 18 August 2026.