[DAILY TRADING] USDMXN Analysis 13 August 2026 – USD/MXN Holds Near 17.06 as a Wide Rate Gap Supports the Peso
 Updated Updated Thu, 2026 August 13 06:39
![[DAILY TRADING] USDMXN Analysis 13 August 2026 – USD/MXN Holds Near 17.06 as a Wide Rate Gap Supports the Peso](https://www.vantagemarkets.co.id/en/wp-content/uploads/sites/22/2026/08/usdmxn-daily-analysis-13-august-2026-featured.webp)
USD/MXN, USD to MXN, USD MXN, USD-MXN, however you type it into the search bar, the Mexico-US rate differential remains a major driver of the peso’s move this week. The USD to MXN rate traded at 17.0625 as of 08:30 (UTC), 16:30 (GMT+8), on 12 August 2026, based on the Vantage USDMXN CFD feed, sitting just under its 50-period and 200-period moving averages after a sharp multi-session slide.
After trading near 17.20 in late July, USD/MXN extended its decline through early August, reaching the 17.03-17.04 area late on 11 August, before steadying into Wednesday’s session. That move keeps the US dollar near its softest level against the peso since May 2024. [1][2]
This USDMXN technical analysis reads the USDMXN TradingView chart and the rate story used for this USDMXN analysis. It does not call the next move.
Key points
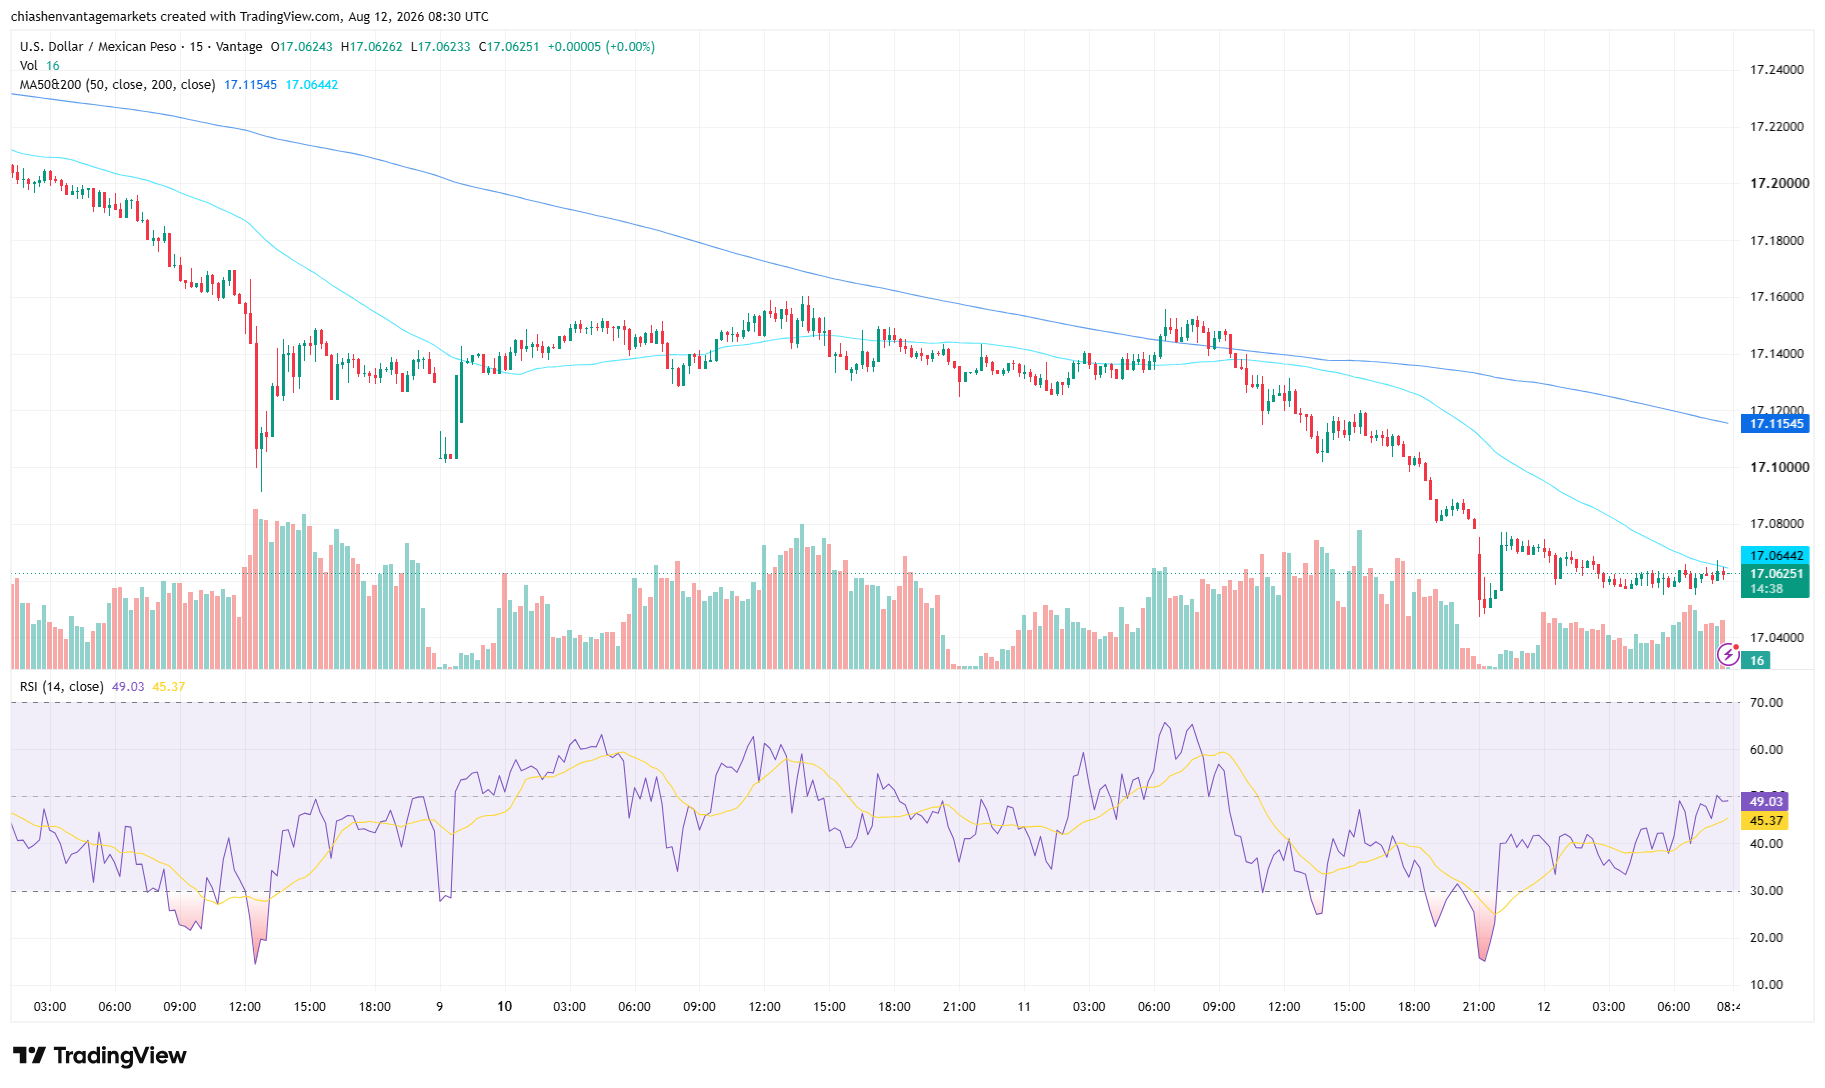
- USDMXN traded near 17.0625 on the 15-minute chart as of 16:30 (GMT+8) on 12 August 2026, sitting just below its 50-period moving average at 17.06442 and its 200-period moving average at 17.11545, both of which now sit overhead as near-term resistance, based on the TradingView setup used for this USDMXN news update.
- After trading near 17.20 in late July, USD/MXN extended its decline through early August to a session low in the 17.03-17.04 area late on 11 August, a move that has coincided with a Mexico-US policy rate gap of roughly 275 to 300 basis points, with Banxico at 6.50% and the Fed at 3.50% to 3.75%.
- Traders are watching Thursday’s US Producer Price Index release, due at 08:30 (ET) on 13 August, as the next input for Federal Reserve rate expectations ahead of the 15 to 16 September FOMC meeting.
What the USDMXN chart is showing
Zoom out on the USDMXN chart and the week has two chapters. After trading near 17.20 in late July, USD/MXN extended its decline through early August. By 7 August the pair was already trading materially lower, in the mid-17.10s, before consolidating broadly between 17.12 and 17.16 through 9 and 10 August, a range where the 200-period moving average kept acting as a lid on every attempted bounce.
A fresh leg lower took hold around midday on 10 August and ran into the evening of 11 August, when USD/MXN touched a session low in the 17.03-17.04 area again. That decline lined up with the sharpest dip on the RSI (14), which fell below 20 on the TradingView setup used for this analysis, about as oversold as this pair has been in weeks, before recovering.
By 12 August, USDMXN had stabilised near 17.0625. The pair sits just below both its 50-period moving average, now reading 17.06442, and its 200-period moving average at 17.11545, meaning both overlays currently sit overhead as near-term resistance rather than support, with the 200-period line still sloping lower. The RSI (14) reads 49.03, just under the neutral 50 mark, with its moving average at 45.37, a picture consistent with fading short-term momentum rather than a strong directional signal. Displayed CFD volume on the 15-minute candles, per the Vantage CFD feed, has remained relatively light through the session.
The rate gap behind the peso’s move
Here is the part that actually explains the move. Banxico kept its overnight interbank rate at 6.50% for a second consecutive meeting, a unanimous decision Trading Economics has tied to easing Mexican inflation alongside continued uncertainty from the Middle East conflict and global trade policy. Mexico’s annual headline inflation rate slowed to 3.12% in July, its lowest reading since May 2020, according to Investing.com. That is a hold alongside a revised inflation outlook, not a fresh hawkish surprise from Mexico’s side.[2][6]
The Federal Reserve, for its part, held its target range at 3.50% to 3.75% at its 28 to 29 July meeting. Three committee members dissented in favour of a hike, the first time three FOMC members have leaned the same hawkish way in years, a tilt CNBC has linked partly to inflation risk from the Middle East conflict.
US labour data has not exactly rewarded that hawkishness either: July payrolls unexpectedly fell by 23,000, well below economists’ expectations for positive job growth, while unemployment eased to 4.1%. The next scheduled FOMC decision falls on 15 to 16 September.[3][4][7]
Put those two decisions side by side and Mexico’s policy rate sits around 275 to 300 basis points above the Fed’s, a gap Trading Economics has flagged as a continuing support for peso carry demand, arithmetic more than surprise. Markets are assessing how durable the gap will be, while CME FedWatch shows expectations for the Fed’s future policy path.[2][8]
There is a non-rates story too. Trading Economics notes that USMCA-compliant Mexican goods remain exempt from the new US tariff measures applied to roughly 60 economies, while Mexico’s trade surplus widened to $4.09 billion in June from $0.51 billion a year earlier. Both factors provide support for the broader Mexican-asset backdrop even as Mexican equities moved the other way this week, with the S&P/BMV IPC index down 1.32% on Tuesday amid broader risk-off positioning in local shares, according to Rio Times Online.[2][1]
Levels traders are watching
| Pair | Support | Resistance | What’s happening |
| USDMXN | 17.03-17.04 (11 Aug low area) / 17.00 (psychological) | 17.0644 (50-period MA) / 17.1155 (200-period MA) / near 17.16 (week’s range high) | Trading just below both moving averages after the decline into 11 August |
Source: the TradingView setup used for this analysis, applied to the Vantage USDMXN CFD chart. Price sits below both moving averages, so the 50-period and 200-period lines are treated here as resistance, not support. Levels as of 16:30 (GMT+8), 12 August 2026.
The same zones work in reverse for anyone reading the MXN/USD chart instead of the USD to MXN chart: the resistance above becomes support on the way down, and the support above becomes resistance.
What to watch
- US PPI, 13 August: The July PPI print lands at 08:30 (ET), the next input markets are pricing into Federal Reserve rate expectations ahead of September’s meeting.
- FOMC meeting, 15-16 September: The Federal Reserve’s next scheduled decision, with markets watching whether July’s hawkish dissents carry into the September statement.
- Banxico guidance: Further commentary from Banxico board members on the durability of the current 6.50% hold remains a factor traders are pricing into the rate differential story.
For the next USD to MXN forecast, or a broader USD MXN forecast, follow Vantage’s USD news and currency trading news coverage, and see Vantage’s guide to trading the USD/MXN currency pair for how this exotic pair behaves as a CFD.
USDMXN has moved through a wide multi-session range this week, and the 15-minute chart shows the pair reacting quickly to both rate headlines and broader risk sentiment. Stop Loss placement around the levels highlighted above is one way traders are managing exposure to sudden moves in either direction, particularly ahead of Wednesday’s PPI release and September’s FOMC meeting.
Leverage works both ways in a market moving on rate differentials and data surprises like this one. Position sizing relative to account equity is worth revisiting ahead of the PPI report, and leverage remains a double-edged tool that can magnify losses just as easily as it can magnify gains.
RISK WARNING: CFDs are complex financial instruments and carry a high risk of losing money rapidly due to leverage. You should ensure you fully understand the risks involved and carefully consider whether you can afford to take the high risk of losing your money before trading.
Disclaimer: The information is provided for educational purposes only and doesn’t take into account your personal objectives, financial circumstances, or needs. It does not constitute investment advice. We encourage you to seek independent advice if necessary. The information has not been prepared in accordance with legal requirements designed to promote the independence of investment research. No representation or warranty is given as to the accuracy or completeness of any information contained within. This material may contain historical or past performance figures and should not be relied on. Furthermore estimates, forward-looking statements, and forecasts cannot be guaranteed. The information on this site and the products and services offered are not intended for distribution to any person in any country or jurisdiction where such distribution or use would be contrary to local law or regulation.
References
[1] “Mexico Markets: IPC & the Peso – August 12, 2026 – Rio Times Online” https://www.riotimesonline.com/mexico-markets-ipc-peso-wednesday-august-12-2026/ Accessed on 12 August 2026.
[2] “Mexican Peso (USDMXN) Live Rate, Chart & Forecast – Trading Economics” https://tradingeconomics.com/mexico/currency Accessed on 12 August 2026.
[3] “Fed rate decision July 2026: Divided Fed holds interest rates steady – CNBC” https://www.cnbc.com/2026/07/29/fed-rate-decision-july-2026.html Accessed on 12 August 2026.
[4] “FOMC Meeting Schedule September 2026 – FedRateCalc” https://fedratecalc.com/fomc-meeting-schedule/september-2026/ Accessed on 12 August 2026.
[5] “Producer Price Index Home – U.S. Bureau of Labor Statistics” https://www.bls.gov/ppi/ Accessed on 12 August 2026.
[6] “USD MXN – US Dollar to Peso Live Rate – Investing.com” https://www.investing.com/currencies/usd-mxn Accessed on 12 August 2026.
[7] “Employment Situation Summary – U.S. Bureau of Labor Statistics” https://www.bls.gov/news.release/empsit.nr0.htm Accessed on 12 August 2026.
[8] “CME FedWatch Tool – CME Group” https://www.cmegroup.com/markets/interest-rates/cme-fedwatch-tool.html Accessed on 12 August 2026.