Updated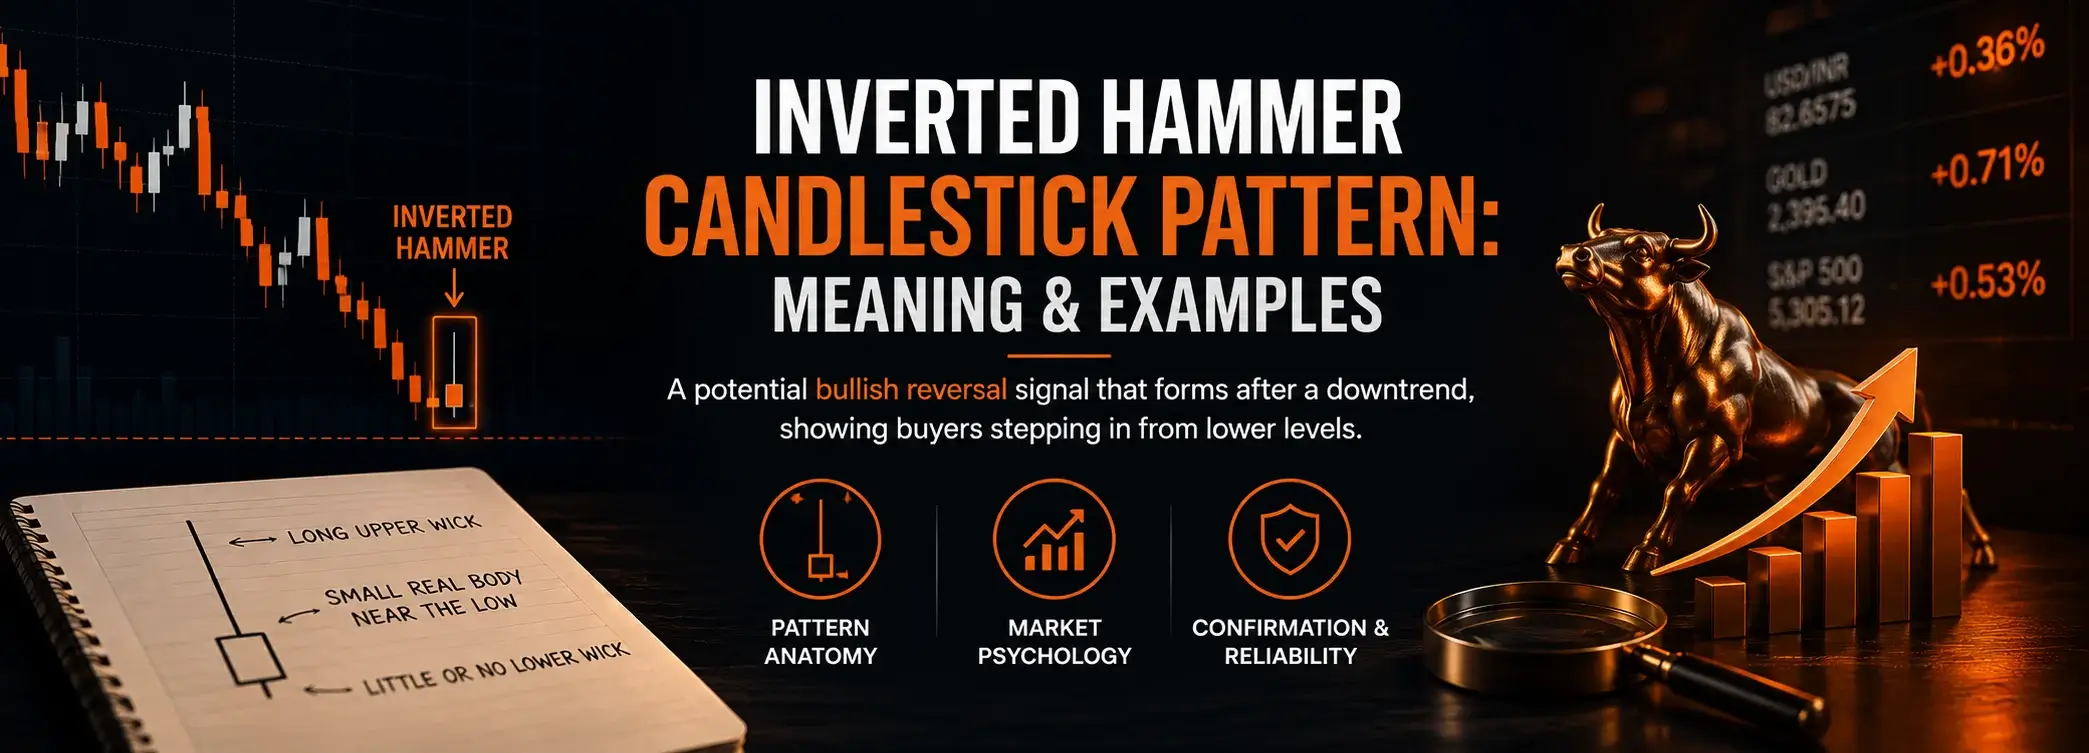
The inverted hammer is one of the first reversal patterns most traders learn to spot — and one of the easiest to misread. It is a single candlestick that forms after a downtrend, with a small real body near the session low and a long upper wick, a shape that suggests selling pressure may be starting to fade.
The catch is that the identical shape becomes a bearish signal, the shooting star, when it appears after an uptrend, so context decides everything. This guide covers what the inverted hammer means and how it forms, how to identify it, the difference between its red and green variants, how it compares with the hammer and the shooting star, and what backtested data suggests about how often it actually delivers a reversal.
Key Points
- An inverted hammer is a single candlestick with a small body near its low and a long upper wick at least twice the body’s length; it forms after a downtrend and points to a possible bullish reversal.
- The colour matters less than the context: a green inverted hammer (a close above the open) is generally read as slightly stronger than a red one (a close below the open), but neither is a signal on its own.
- Backtested data is a useful reality check, though historical figures should be considered alongside the definition and methodology used. In Thomas Bulkowski’s research, which uses a two-candle definition of the inverted hammer, the pattern acted as a bearish continuation around 65% of the time, which is why confirmation from subsequent price action is important before drawing conclusions [2].
What Is an Inverted Hammer Candlestick?
An inverted hammer is a single-candlestick pattern that appears at the bottom of a downtrend and signals a potential shift from selling to buying pressure. It takes its name from its shape: turn a standard hammer upside down and you have an inverted hammer — a small real body sitting near the low of the range, with a long wick pushing up from the top.
You will also see it called an inverse hammer, a reverse hammer, or simply an upside-down hammer. These are all the same candle. Definitions of the inverted hammer can vary between sources. This guide uses the commonly referenced single-candle definition, while some analysts, including Thomas Bulkowski, define and test the pattern as a two-candle formation. Where historical performance data is discussed, the methodology used should be considered. The real body is the block between the open and the close; the wick, or shadow, is the thin line marking the highest and lowest prices touched during the session.
Three features define the pattern:
- Small real body: the distance between the open and the close is small and sits in roughly the lower third of the candle’s range.
- Long upper shadow: the upper wick is at least twice the height of the body, showing buyers pushed price well above the open before sellers pulled it back [1].
- Little or no lower shadow: price barely dipped below the open, so the tail beneath the body is short or absent.
On its own, the candle is only a hint. It belongs to the broader family of candlestick patterns that traders read for clues about shifting sentiment, and like most of them it carries far more weight when the trend and the following candle agree with it.
What an Inverted Hammer Means and the Psychology Behind It
To read the inverted hammer, follow the story the single session tells. Price arrives in a downtrend, so sellers start in control. During the session buyers step in and drive price sharply higher — that push is what forms the long upper wick. Before the close, though, sellers fight back and drag price down near where it opened, leaving only a small body at the bottom.
That sequence is why the candle is read as a tentative bullish sign rather than a firm one. The long upper shadow shows buyers were willing and able to bid price up from a depressed level; the small body shows they could not hold those gains into the close. The balance between buyers and sellers has shifted enough to be worth noting, but not enough to declare the downtrend over.
The psychology is a tug-of-war caught mid-pull. After a run of falling candles, the first serious attempt by buyers to lift price can signal that conviction among sellers is thinning. Whether that probe becomes a genuine reversal depends on what happens next, which is exactly why the candle rarely means much in isolation.
One point is often missed: the message is about location, not just shape. The identical candle carries no reversal implication in the middle of a sideways range — it only speaks when it interrupts a clear decline.
How to Identify an Inverted Hammer on a Chart
Spotting a valid inverted hammer is a matter of checking a few proportions and, just as importantly, the trend it sits in. Because retail traders may access markets such as forex, indices, and commodities through Contracts for Difference (CFDs), subject to product availability and applicable jurisdictional restrictions, the same checklist applies whether you are reading a USD/INR forex CFD, an index CFD, or a gold CFD.
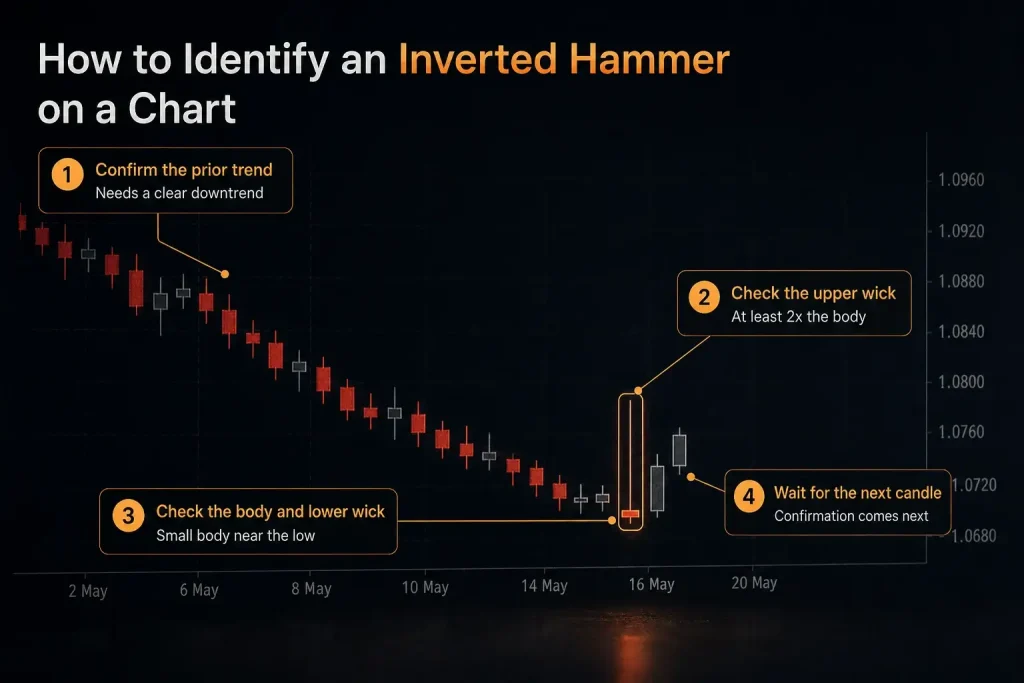
Work through four checks:
- Confirm the prior trend: the candle must appear after a clear downtrend. Without a preceding decline there is nothing for the pattern to reverse, and a lookalike candle in a flat market is just noise.
- Check the upper wick: it should be long — at least twice the length of the real body. On a USD/INR daily candle, that might mean a body spanning a handful of pips with an upper wick two to three times as tall. [1]
- Check the body and lower wick: the body should be small and sit near the session low, with little or no wick beneath it.
- Wait for the next candle: identification is not a green light. The pattern is only treated as active once a following candle confirms it, covered further below.
Reading these proportions is a core part of learning to interpret a candlestick chart, and the inverted hammer is one of the clearer shapes to train your eye on. It can appear on any timeframe, though many traders give more weight to daily and weekly candles, where a single session reflects a full day or week of order flow rather than a few minutes of intraday movement.
Red vs Green Inverted Hammer Candlesticks
The inverted hammer can print in either colour, and the colour tells you what happened between the open and the close.
- Green (or white) inverted hammer: closes above its open. Buyers finished the session slightly ahead, which many traders read as the marginally stronger version because it shows a little follow-through.
- Red (or black) inverted hammer: closes below its open. Buyers pushed price up during the session but ended just under the open, so the bullish hint is weaker — though still present, since the long upper wick and the location after a downtrend are what matter most.
| Variant | Close Relative to Open | How Traders Tend to Read It |
| Green inverted hammer | Close above open | Slightly stronger; buyers kept a small edge into the close |
| Red inverted hammer | Close below open | Weaker hint; buyers led intraday but faded by the close |
The honest takeaway is that colour is a secondary detail. A green candle is generally seen as slightly more encouraging than a red one, but neither colour turns the inverted hammer into a bullish or bearish verdict by itself. Structure and trend context outweigh colour every time, and both variants still need the same confirmation before they mean much.
How the Inverted Hammer Compares to Similar Patterns
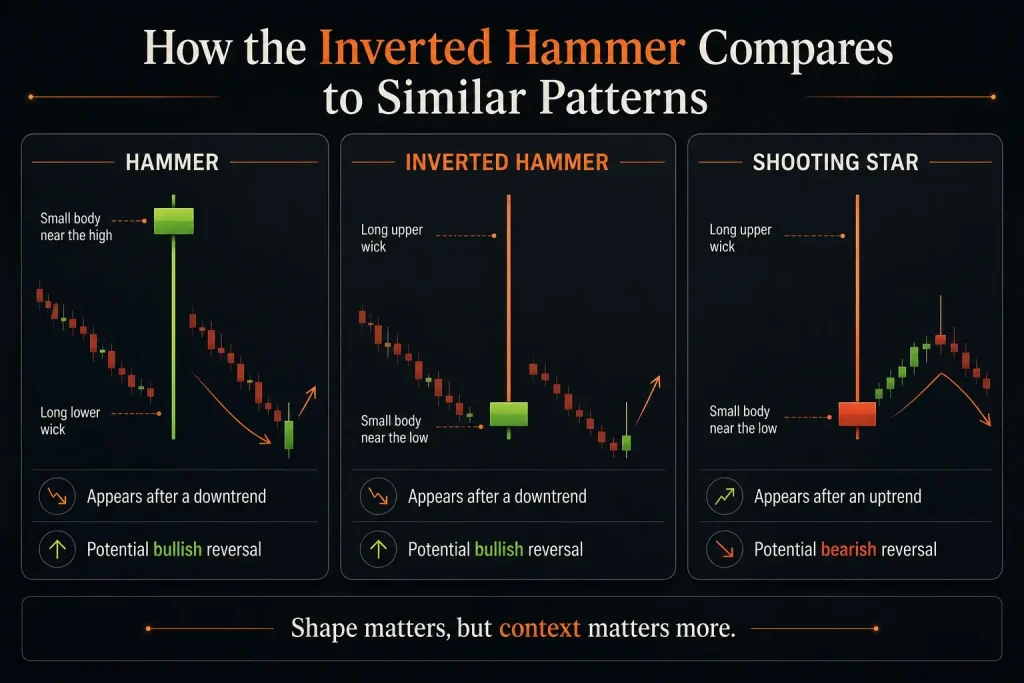
Three single-candle patterns are constantly mixed up, because two of them share a shape and two of them share a location. Table 2 lays them side by side; the sections below unpack the two comparisons that cause the most confusion.
| Pattern | Shape | Appears After | Signal |
| Hammer | Small body near the high, long lower wick | Downtrend | Potential bullish reversal |
| Inverted hammer | Small body near the low, long upper wick | Downtrend | Potential bullish reversal |
| Shooting star | Small body near the low, long upper wick | Uptrend | Potential bearish reversal |
Inverted Hammer vs Hammer
Both are bullish reversal candles that form after a downtrend, so the confusion is understandable — the difference is which way the wick points. The hammer has its small body near the top and a long wick hanging below, showing sellers were beaten back after driving price down.
The inverted hammer flips that: the body sits at the bottom and the long wick points up, showing buyers tested higher before being pushed back. Because the hammer ends the session with buyers clearly on top, it is usually treated as the firmer of the two, while the inverted hammer is the more tentative signal that leans harder on confirmation.
For the other side of the pair, our guide to the hammer candlestick pattern covers it in depth.
Inverted Hammer vs Shooting Star
This is the pairing that catches people out, because the two candles are visually identical — a small body at the low, a long upper wick, and a minimal lower wick. Everything hinges on context.
An inverted hammer forms after a downtrend and hints at a bullish reversal; a shooting star forms after an uptrend and warns of a bearish one. Same shape, opposite message. A trader who labels the candle by shape alone, without checking whether the market was rising or falling into it, can read the signal exactly backwards.
Confirming an Inverted Hammer Signal
On its own the inverted hammer is a question, not an answer. Confirmation is the process of waiting for further evidence before treating the candle as meaningful, and most approaches share the same first step.
- The next candle: the most common confirmation is a following candle that closes above the high of the inverted hammer. That close suggests buyers have built on the intraday push rather than letting it fade. [1]
- Volume: a pattern that forms on higher trading volume is generally seen as more convincing than one on thin volume, since it reflects wider participation in the move.
- Location at support: an inverted hammer that appears at a recognised support level — a price area where buyers have stepped in before — tends to carry more weight than one floating in open space.
- Agreement from indicators: some traders cross-check with technical indicators such as the Relative Strength Index (RSI); an oversold reading turning up as the candle forms is often treated as supporting evidence.
Timeframe plays into confirmation too. On a daily chart the candle closes at the end of the trading day, so a confirmation candle takes another full session to form; on shorter intraday charts — say around the busier London–New York overlap in the evening IST — signals appear faster but carry more noise.
None of these steps removes risk. They are ways some traders try to filter weaker setups, and no combination guarantees the reversal will follow.
A Worked Inverted Hammer Example
Textbook diagrams make the inverted hammer look obvious. Live charts rarely do, which is why it helps to see the pattern in a real market context rather than an idealised sketch.
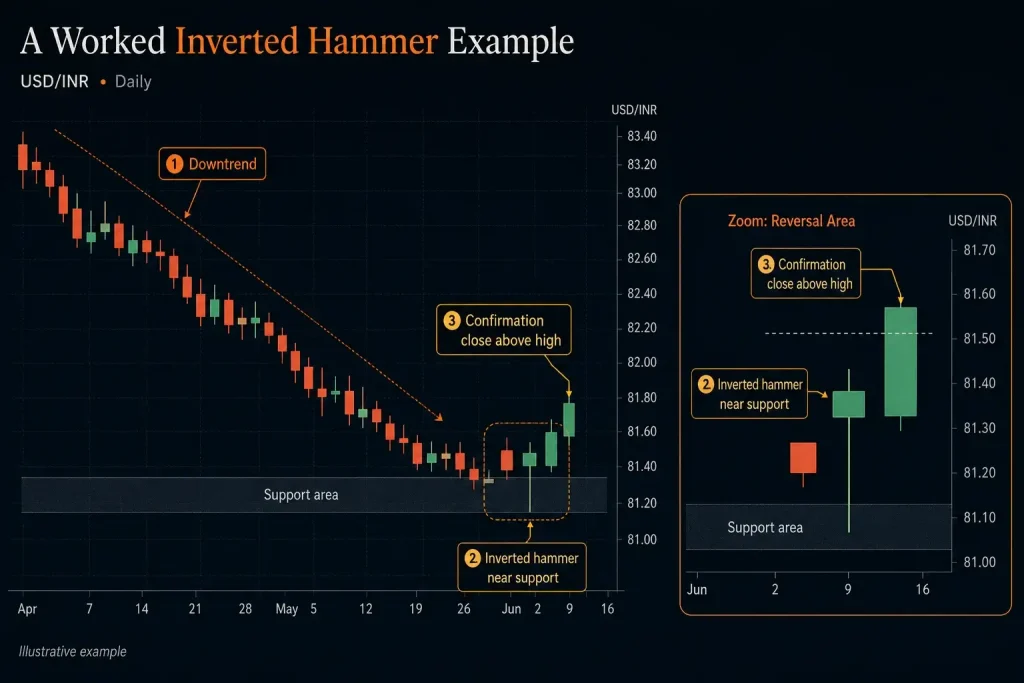
In a setup like the one above, the reading would run in order: first, a sustained downtrend establishes the context; second, an inverted hammer prints near a support area, its long upper wick showing buyers probing higher; third, the next candle closes above the inverted hammer’s high, which is the point many traders would treat as confirmation.
Read together, those three elements are what separate a tradeable observation from a random long-wicked candle. Where available and permitted in the relevant jurisdiction, the same structure could also be applied to other CFD instruments, such as index CFDs or commodity CFDs, without changing how the candle itself is interpreted.
The above example is for illustrative purposes only and does not constitute a recommendation to buy, sell, or hold any financial instrument.
It is worth stressing what the chart cannot tell you: it shows one case where the pattern was followed by a move higher, not proof that it always will be. A single favourable example is a teaching aid, not evidence of reliability — which is where backtested data, in the next section, is a more honest guide.
Limitations and False Signals
The inverted hammer’s biggest weakness is the one its bullish reputation hides: it fails often. Backtested evidence makes the point bluntly.
In Thomas Bulkowski’s research for the Encyclopedia of Candlestick Charts, which uses a two-candle definition of the inverted hammer, the pattern acted as a bearish continuation around 65% of the time — meaning price continued lower more often than it reversed upward [2]. As this methodology differs from the single-candle definition described in this guide, the figure should be interpreted as historical context rather than a direct measure of every inverted hammer formation.
The same research ranks the inverted hammer 6th out of 103 candlestick types based on Bulkowski’s overall performance ranking. Its strongest average move was observed after an upward breakout in a bear market, where the pattern produced an average move of 7.74%. However, these historical results reflect Bulkowski’s tested methodology and should not be interpreted as a guarantee that an individual inverted hammer will lead to a reversal.
The lesson in that split is precise: the inverted hammer can lead to a good move, but mainly in the minority of cases where confirmation actually arrives — which is why acting before that confirmation is where most of the damage is done.
A few conditions make false signals more likely:
- Sideways or choppy markets: with no clear downtrend to reverse, long-wicked candles appear constantly and mean little.
- Very short timeframes: on one- or five-minute charts, market noise throws up inverted-hammer shapes that rarely lead anywhere.
- No confirmation: treating the candle as a signal in itself, without waiting for the next candle, ignores the base rate above.
- Ignoring volume and location: a candle far from any support area and on thin volume is the weakest version of the setup.
Like any single candlestick, the inverted hammer is one input among many, not a system. It can sharpen timing when it lines up with trend, volume, and confirmation, but it cannot offset poor risk management, and no pattern removes the risk that a trade moves against you.
Leverage can increase losses when a CFD position moves against you, so a setup that looks clear on a chart can still result in significant losses if the market moves unexpectedly.
Why the Inverted Hammer Needs Confirmation
The inverted hammer earns its place as a reversal pattern not because it is reliable on its own—the data shows that it usually is not—but because it highlights a moment worth watching. A small body positioned near the candle’s low, with a long upper wick, can indicate that buyers have begun testing higher prices after a decline.
The significance of that move depends entirely on what comes next: the trend it interrupts, the volume behind it, the support level beneath it, and, above all, the candle that follows.
Read as a warning that warrants a closer look, the inverted hammer can be a useful part of a technical analysis toolkit. Read as a standalone buy signal, however, it may lead traders to act before the broader downtrend has reversed.
The difference lies in confirmation.
Frequently Asked Questions
Is an Inverted Hammer Bullish or Bearish?
An inverted hammer is a bullish reversal pattern when it forms after a downtrend — it hints that selling pressure may be fading and that buyers are testing higher. It is only bullish in that context, though. The identical shape after an uptrend is a shooting star, which is a bearish signal, so the trend the candle sits in decides its meaning.
Is a Green or Red Inverted Hammer Better?
A green inverted hammer, which closes above its open, is generally read as slightly stronger than a red one, which closes below its open, because it shows a little more follow-through from buyers. The difference is minor. Both are treated the same way in practice — as a tentative signal that still needs confirmation — and the trend and location matter far more than the colour.
What Is the Difference Between an Inverted Hammer and a Shooting Star?
They are the same shape — a small body near the low with a long upper wick — but they appear in opposite places. An inverted hammer forms at the bottom of a downtrend and points to a possible bullish reversal, while a shooting star forms at the top of an uptrend and points to a possible bearish one. Because the candles look identical, the surrounding trend is the only reliable way to tell them apart.
What Does an Inverted Hammer in a Downtrend Indicate?
A downtrend is the setting where the inverted hammer carries its usual meaning: a potential bullish reversal. The long upper wick shows buyers pushing price up from a low point, suggesting the downward momentum may be weakening. It remains a tentative signal — traders typically wait for the next candle to close above the pattern’s high before treating the possible reversal as active.
What Does an Inverted Hammer in an Uptrend Mean?
Strictly speaking, the pattern that appears at the top of an uptrend is not an inverted hammer at all — it is a shooting star. The shape is the same, but in an uptrend the long upper wick suggests buyers failed to hold higher prices, which is read as a potential bearish reversal rather than a bullish one. This is why checking the prior trend matters before labelling the candle.
Is an Inverted Hammer the Same as a Reverse Hammer?
Yes. ‘Reverse hammer’, ‘inverse hammer’, and ‘upside-down hammer’ are all informal names for the same pattern — an inverted hammer. They describe the same candle: a small body near the low with a long upper wick, forming after a downtrend. The different labels can be confusing, but there is no separate pattern behind them.
How Reliable Is the Inverted Hammer Pattern?
On its own, not very. Backtested data suggests price continues lower more often than it reverses after an inverted hammer, which is why traders rarely act on the candle in isolation. Its usefulness improves when it appears after a clear downtrend, at a support area, on healthy volume, and is confirmed by the following candle — but even then, no candlestick pattern removes the risk that a trade moves against you.
RISK WARNING: CFDs are complex financial instruments and carry a high risk of losing money rapidly due to leverage. You should ensure you fully understand the risks involved and carefully consider whether you can afford to take the high risk of losing your money before trading.
Disclaimer: The information is provided for educational purposes only and doesn’t take into account your personal objectives, financial circumstances, or needs. It does not constitute investment advice. We encourage you to seek independent advice if necessary. The information has not been prepared in accordance with legal requirements designed to promote the independence of investment research. No representation or warranty is given as to the accuracy or completeness of any information contained within. This material may contain historical or past performance figures and should not be relied on. Furthermore estimates, forward-looking statements, and forecasts cannot be guaranteed. The information on this site and the products and services offered are not intended for distribution to any person in any country or jurisdiction where such distribution or use would be contrary to local law or regulation.
References
- Hammer Candlestick: What It Is and How Investors Use It — Investopedia. https://www.investopedia.com/terms/h/hammer.asp Accessed 4 Aug 2026
- Inverted Hammer Candle Pattern — Thomas N. Bulkowski, Encyclopedia of Candlestick Charts. https://thepatternsite.com/HammerInv.html Accessed 4 Aug 2026