Updated
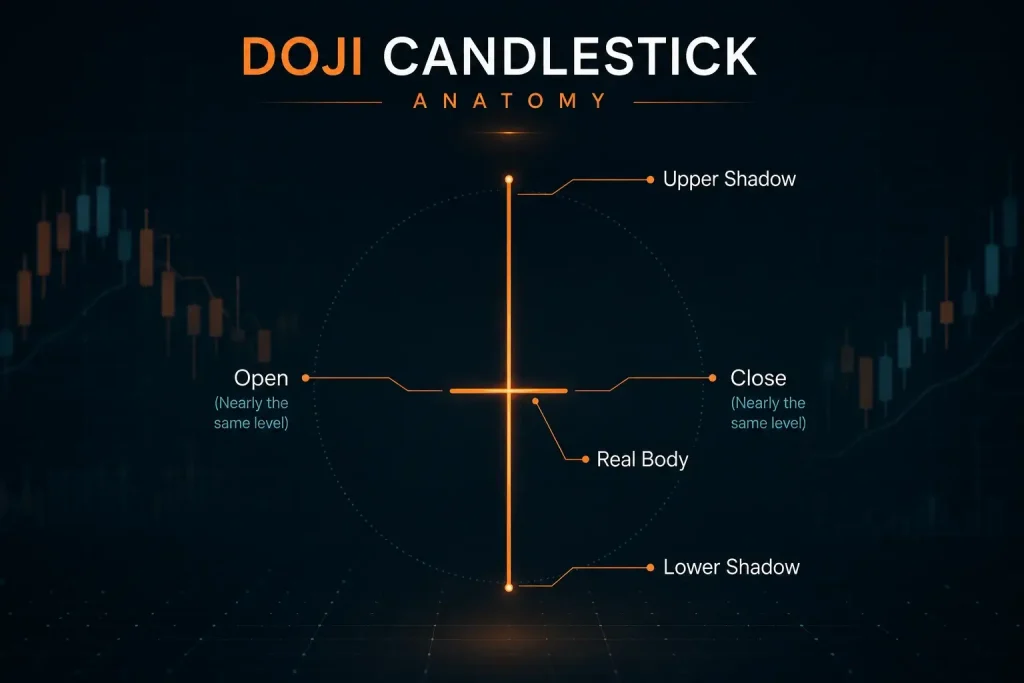
Some chart signals shout; the doji whispers. A doji candlestick is a single candle that forms when a market’s open and close finish at almost the same price, leaving a very small body with wicks above and below — the visual sign of buyers and sellers ending a session evenly matched.
That shape can hint a trend is running out of momentum, but on its own it rarely settles the direction. This guide covers what a doji candlestick is, the main types, how to read one inside an uptrend or a downtrend, and where it falls short — with two worked examples on real Vantage charts, USD/INR and EUR/USD.
Key Points
- A doji candlestick marks indecision, not direction: because the open and close are almost equal, the candle itself does not tell you which way price will break next.
- Its meaning depends on context — the trend that came before it, where it sits relative to key price levels, and whether the following candle confirms the signal.
- The four common types (standard, dragonfly, gravestone, and long-legged) differ only in where the open and close sit within the session’s range, and each carries a slightly different read.
What Is a Doji Candlestick?
A doji candlestick is a single candle whose open and close finish at virtually the same level, so the real body shrinks to a thin line or disappears altogether. Every candlestick is built from four data points — the open, high, low, and close of a session. In a doji, the open and close land on top of each other, while the high and low stretch away as thin lines called shadows, or wicks.
The result usually looks like a cross, a plus sign, or an inverted cross. The word “doji” comes from Japanese and means roughly “the same thing”, a nod to how unusual it is for the open and close to finish together. It is one member of the wider family of candlestick patterns, most of which still carry their original Japanese names.
Candlestick charting itself traces back to 18th-century Japanese rice trading — the merchant Munehisa Homma (1724–1803) is usually credited with the early groundwork — and the American analyst Steve Nison introduced the method to Western markets around 1989–1991 [1,2]. What makes the doji worth knowing is not the shape itself, but the stand-off behind it and what that pause can precede.
What Does a Doji Candlestick Indicate?
A doji candlestick indicates indecision — a session where neither buyers nor sellers gained control and price finished where it started. It suggests the forces of supply and demand are becoming more evenly matched, and that a change in trend may be near. But that signal is conditional, not automatic.
Context does most of the work. A doji sitting among other small-bodied candles carries little weight, while one that appears straight after a long directional candle stands out far more. After a sustained uptrend, a doji can suggest buying pressure is starting to weaken; after a decline, it can suggest selling pressure is easing. On its own, though, a doji is not a reversal — it flags a pause, and traders often wait for the next candle before drawing a conclusion.
Red vs Green Doji Candlesticks
A red or green doji tells you very little on its own, because the body is so small that its colour — which only reflects whether the close finished a fraction below or above the open — carries almost no information.
Some platforms shade a doji green when the close sits a hair above the open and red when it sits a hair below, but on a true doji that distinction is largely cosmetic.
The shadow positions and the surrounding context matter far more than the colour when weighing whether the candle leans bullish or bearish.
Types of Doji Candlesticks
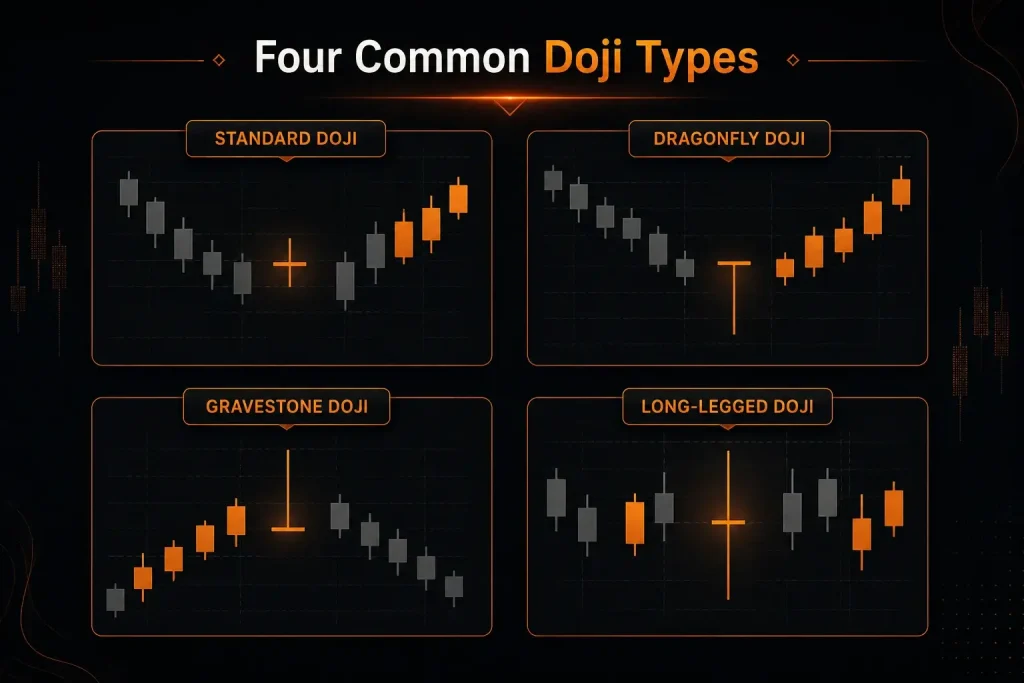
The four common doji types share the same defining feature — an open and close that finish close together — and differ only in where that body sits within the session’s range and how long the shadows are. That small structural difference changes the read.
Standard Doji
A standard doji is the basic form, where the open and close sit near the middle of the session’s range, leaving short, roughly equal upper and lower shadows. It is the clearest picture of a genuine stand-off: price probed both directions and returned to where it began. Read in isolation it is neutral, so its significance comes almost entirely from the trend and levels around it.
Key features:
- Open and close finish near the centre of the range
- Short, roughly balanced upper and lower shadows
- Signals a neutral, even contest between buyers and sellers
- Carries weight mainly after a strong directional move
Dragonfly Doji
A dragonfly doji is a doji where the open, close, and high all sit at or near the top of the range, leaving a long lower shadow and little to no upper shadow. The shape shows that sellers pushed price well below the open during the session, but buyers returned it to the top by the close. Appearing after a downtrend, it is often read as a potential bullish signal — though, like every doji, it needs confirmation rather than being acted on alone.
Key features:
- Open, close, and high cluster near the top of the range
- Long lower shadow; minimal or no upper shadow
- Shows rejection of lower prices within the session
- Often watched after a downtrend as a possible turning point
Gravestone Doji
A gravestone doji is the mirror image of the dragonfly, where the open, close, and low sit at or near the bottom of the range, leaving a long upper shadow and little to no lower shadow. Buyers drove price up during the session, but sellers dragged it back to the open by the close. Appearing after an uptrend, it is often read as a potential bearish signal, again pending confirmation from what follows.
Key features:
- Open, close, and low cluster near the bottom of the range
- Long upper shadow; minimal or no lower shadow
- Shows rejection of higher prices within the session
- Often watched after an uptrend as a possible turning point
Long-Legged Doji
A long-legged doji has a small body near the centre of the range with long upper and lower shadows, showing that price ranged widely in both directions before closing near the open. It is the most dramatic picture of indecision: a volatile session that resolved nothing. Because the swings are large, this type can be a useful flag that conviction has drained out of a move, but it can also simply reflect noisy, directionless trading.
Key features:
- Small central body with long upper and lower shadows
- Reflects wide two-way movement within the session
- Signals heightened indecision and volatility
- Can appear in choppy ranges as well as at turning points
| Doji Type | Where Open & Close Sit | Common Read |
| Standard | Near the middle of the range, short balanced shadows | Neutral indecision; context decides |
| Dragonfly | At or near the high, long lower shadow | Possible bullish signal after a downtrend |
| Gravestone | At or near the low, long upper shadow | Possible bearish signal after an uptrend |
| Long-legged | Near the middle, long shadows both sides | Strong indecision after a wide-ranging session |
Doji vs Spinning Top
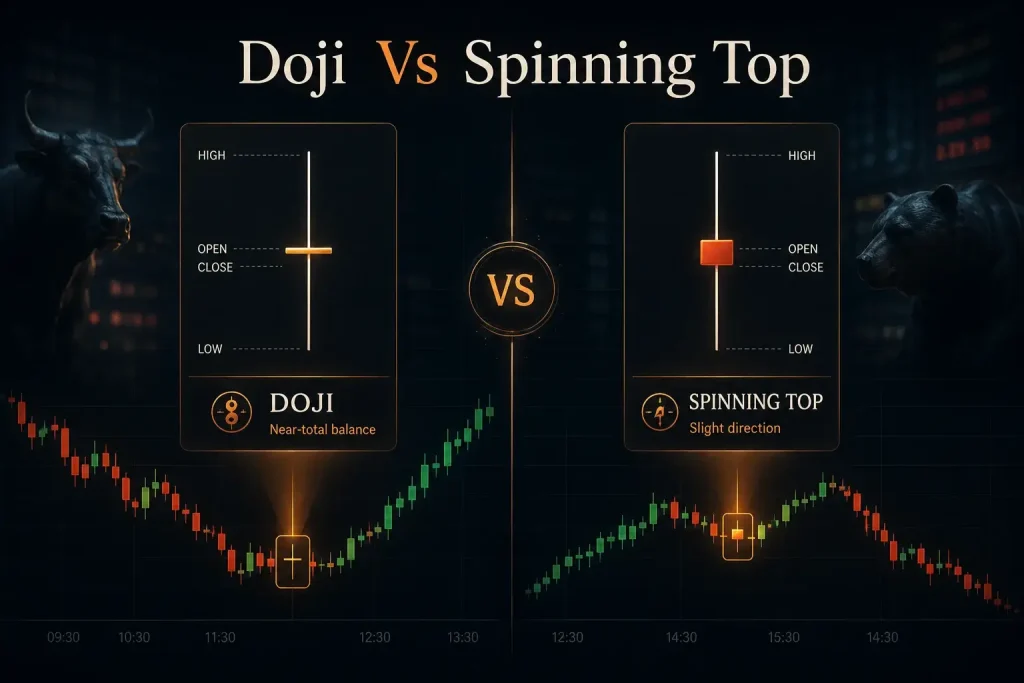
A doji and a spinning top both signal indecision, but they differ by body size: a doji has virtually no body because the open and close are nearly equal, while a spinning top has a small but clearly visible body with long shadows on either side.
Both reflect an even contest between buyers and sellers, and both often appear when a market pauses [2]. The practical difference is one of degree — the spinning top shows that price did close a little away from where it opened, whereas the doji shows almost no separation at all.
| Feature | Doji | Spinning Top |
| Real body | Virtually none (open ≈ close) | Small but clearly visible |
| Shadows | Vary by type | Long on both sides |
| What it signals | Indecision, near-total balance | Indecision with slight direction |
| Typical setting | Pause after a strong move | Pause within choppy or ranging price |
How to Read a Doji Candlestick in Context
A doji is only as useful as the context you read it in. The same candle means different things after a rally, after a sell-off, or in the middle of a range — so the sequence around it matters as much as the candle itself.
In an Uptrend
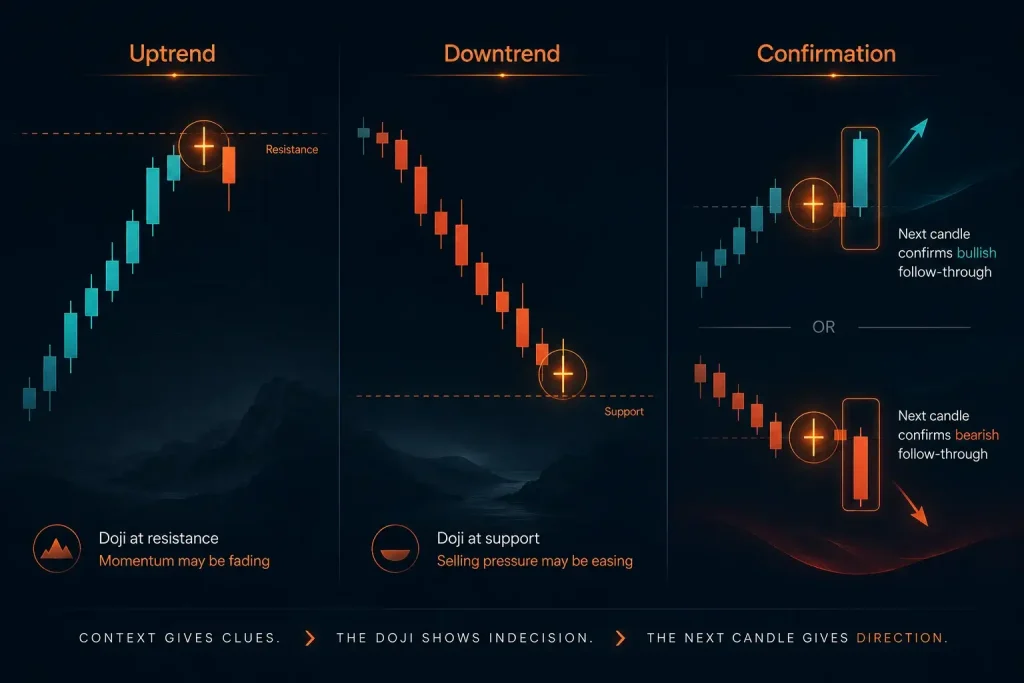
In an uptrend, a doji signals that the buying momentum that carried price higher may be fading, as buyers and sellers reach a temporary balance. After a long run of strong green candles, a doji — often a standard or gravestone form — can be an early hint that the trend is tiring. It is not a sell signal by itself; many traders treat it as a prompt to watch the next candle and any nearby resistance more closely.
In a Downtrend
In a downtrend, a doji signals that selling pressure may be easing, with sellers no longer able to force a lower close. A dragonfly or standard doji appearing after a sustained decline can suggest the move is losing force, particularly near a level where price has previously found buyers. As always, the candle raises a question rather than answering it.
Confirming the Signal
Confirmation means waiting for the candle after the doji to close decisively in one direction before treating the indecision as resolved. Steve Nison’s own guidance was that candlesticks work best alongside other tools rather than in isolation — trend context, momentum indicators, and areas of support and resistance all help.
Some traders wait for a strong close beyond the doji’s range; others give more weight to a doji that forms at a level the market has already tested. No approach removes the risk of a false signal.
Doji Candlesticks on Real Charts
Textbook diagrams make a doji look obvious. Live charts are messier — the candle appears mid-flow, surrounded by noise, and its meaning only becomes clear from the sessions around it.
The two examples below use Vantage’s own daily charts, marked up to show a real doji in each. Both USD/INR and EUR/USD are examples of currency pairs that may be analysed using forex CFD charts, subject to product availability and applicable jurisdictional restrictions. CFDs (Contracts for Difference) allow speculation on price movements without owning the underlying currencies. For more on reading price charts, the mechanics carry across instruments.
A Doji on USD/INR
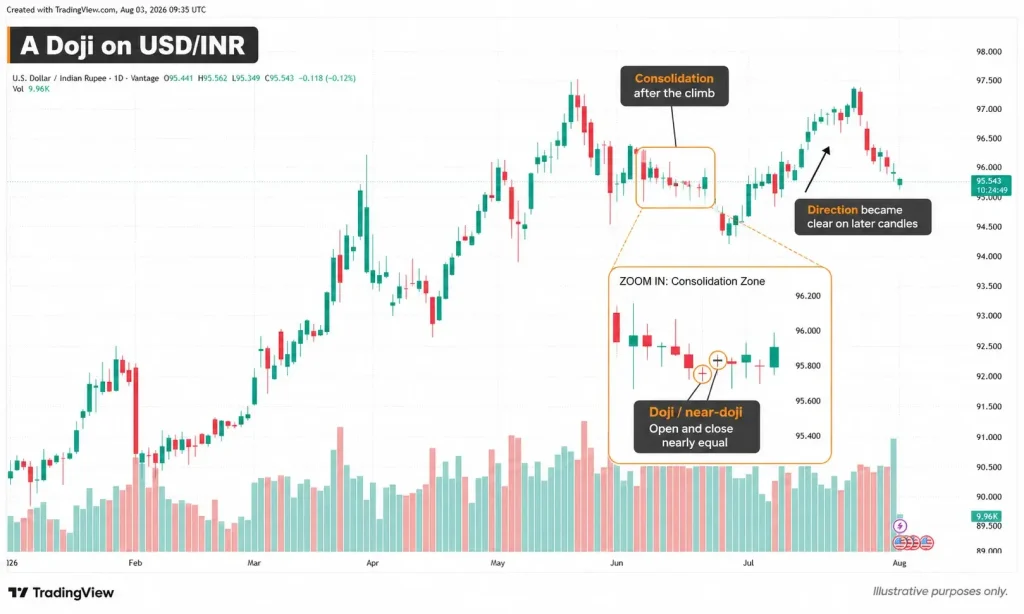
On the USD/INR daily chart, the price movement showed a period of consolidation near ₹89.0 in early October. During that pause, several doji and near-doji candles printed in a row — each opening and closing within a whisker of the other, the small bodies showing buyers and sellers evenly matched after the climb. Each daily candle here closes at the end of the trading day (early evening in IST), and it is that close landing back near the open that defines the doji.
In the sessions that followed, price fell sharply before eventually resuming its move higher; as of 14 July 2026 the pair was trading around ₹96.08. The dojis marked the hesitation, not the outcome — the direction only became clear once later candles resolved it.
The above example is for illustrative purposes only and does not constitute a recommendation to buy, sell, or hold any financial instrument.
Limitations of the Doji Candlestick
The doji’s biggest limitation is also its defining trait: because it only signals indecision, it never tells you what happens next. Dojis appear frequently, especially on lower timeframes where small bodies form constantly, and that frequency dilutes their reliability — a doji is generally more meaningful after a strong move or at a level the market has already tested than in the middle of quiet, choppy trading.
There is also a degree of subjectivity: how equal do the open and close need to be before a candle counts as a doji rather than a small-bodied candle? Different traders draw the line differently. And because currency pairs like these are traded with leverage as CFDs, a move against a position can magnify losses quickly. No pattern removes risk, and a doji that looks like a turning point can just as easily precede a continuation.
Reading Indecision, Not Predicting Reversals
A doji candlestick is a snapshot of a market that could not make up its mind — a session where the open and close finished together and neither side won. Its value is not in calling the next move but in flagging the pause, then pointing you toward the things that actually decide direction: the trend before it, the levels around it, and the candle that comes next. Treated as a question rather than an answer, the doji earns its place in technical analysis; treated as a prediction, it tends to disappoint.
Frequently Asked Questions
What is a doji candlestick?
A doji candlestick is a single candle whose open and close finish at almost the same price, leaving a very small or non-existent body with shadows above and below. It represents a session in which buyers and sellers ended evenly matched. The shape often resembles a cross or plus sign, and it is used in technical analysis to flag moments of market indecision.
What does a doji candlestick indicate?
A doji indicates indecision — a balance between buying and selling pressure where neither side gained control. After a strong trend it can hint that momentum is fading and a change may be near, but on its own it does not confirm a reversal. Its message depends heavily on the trend and price levels around it.
How do you read a doji candlestick?
You read a doji by looking at its context rather than the candle alone. Note the trend that preceded it, the type of doji (which shows where the open and close sat in the range), and whether it formed near a significant price level. Many traders then wait for the next candle to close decisively before treating the signal as confirmed.
Is a doji candlestick bullish or bearish?
A doji is neither inherently bullish nor bearish; it is a neutral, indecision candle. Its lean depends on where it appears — a dragonfly after a downtrend is often read as potentially bullish, while a gravestone after an uptrend is often read as potentially bearish. The green or red colour of a doji carries little meaning because the body is so small.
What is the difference between a doji and a spinning top?
Both signal indecision, but a doji has virtually no body because the open and close are nearly identical, whereas a spinning top has a small but clearly visible body with long shadows on both sides. In effect, the spinning top shows price closed a little away from its open, while the doji shows almost no separation. The two are read in similar ways, with the doji representing the more complete stand-off.
Are doji candlesticks reliable?
Doji candlesticks are best treated as one input among several rather than a reliable standalone signal. They appear often, produce false readings — particularly on lower timeframes — and are more dependable when they follow a strong move, sit at a tested level, and are confirmed by the next candle. No candlestick pattern removes the risk that price moves against expectations.
RISK WARNING: CFDs are complex financial instruments and carry a high risk of losing money rapidly due to leverage. You should ensure you fully understand the risks involved and carefully consider whether you can afford to take the high risk of losing your money before trading.
Disclaimer: The information is provided for educational purposes only and doesn’t take into account your personal objectives, financial circumstances, or needs. It does not constitute investment advice. We encourage you to seek independent advice if necessary. The information has not been prepared in accordance with legal requirements designed to promote the independence of investment research. No representation or warranty is given as to the accuracy or completeness of any information contained within. This material may contain historical or past performance figures and should not be relied on. Furthermore, estimates, forward-looking statements, and forecasts cannot be guaranteed. The information on this site and the products and services offered are not intended for distribution to any person in any country or jurisdiction where such distribution or use would be contrary to local law or regulation.
References
- “Introduction to Candlesticks – StockCharts.com” https://chartschool.stockcharts.com/table-of-contents/chart-analysis/candlestick-charts/introduction-to-candlesticks Accessed 4 Aug 2026
- “Candlestick Patterns Explained: A Guide for Traders – Britannica Money” https://www.britannica.com/money/candlestick-pattern-charts Accessed 4 Aug 2026