Updated
The head and shoulders pattern is a chart formation that signals a potential reversal of an uptrend, made up of three peaks — a higher central peak (the head) between two lower peaks (the shoulders) — sitting above a support line called the neckline. In Japanese candlestick analysis it is also called the “Three Buddha”, a nod to its three-peak shape.
This guide covers how the pattern forms, how volume behaviour confirms or weakens it, how to project a measured-move target, what happens when the pattern fails, and how the inverse version works — with a worked example on Tesla shares as a CFD.
Key Points
- A head and shoulders pattern is only considered complete once price closes below the neckline; until that break, it remains an unconfirmed formation rather than a reversal signal.
- Volume typically declines across the three peaks and often rises on the neckline break — when volume does not fall on the right shoulder, many technical analysts treat the pattern as weaker or unconfirmed.
- The measured-move target is estimated by subtracting the head-to-neckline height from the break point, though real market outcomes frequently undershoot or overshoot this projection.
What Is a Head and Shoulders Pattern?
The head and shoulders pattern is a bearish reversal formation in technical analysis that appears after an uptrend and often signals that buyer momentum is fading while sellers prepare to take control.
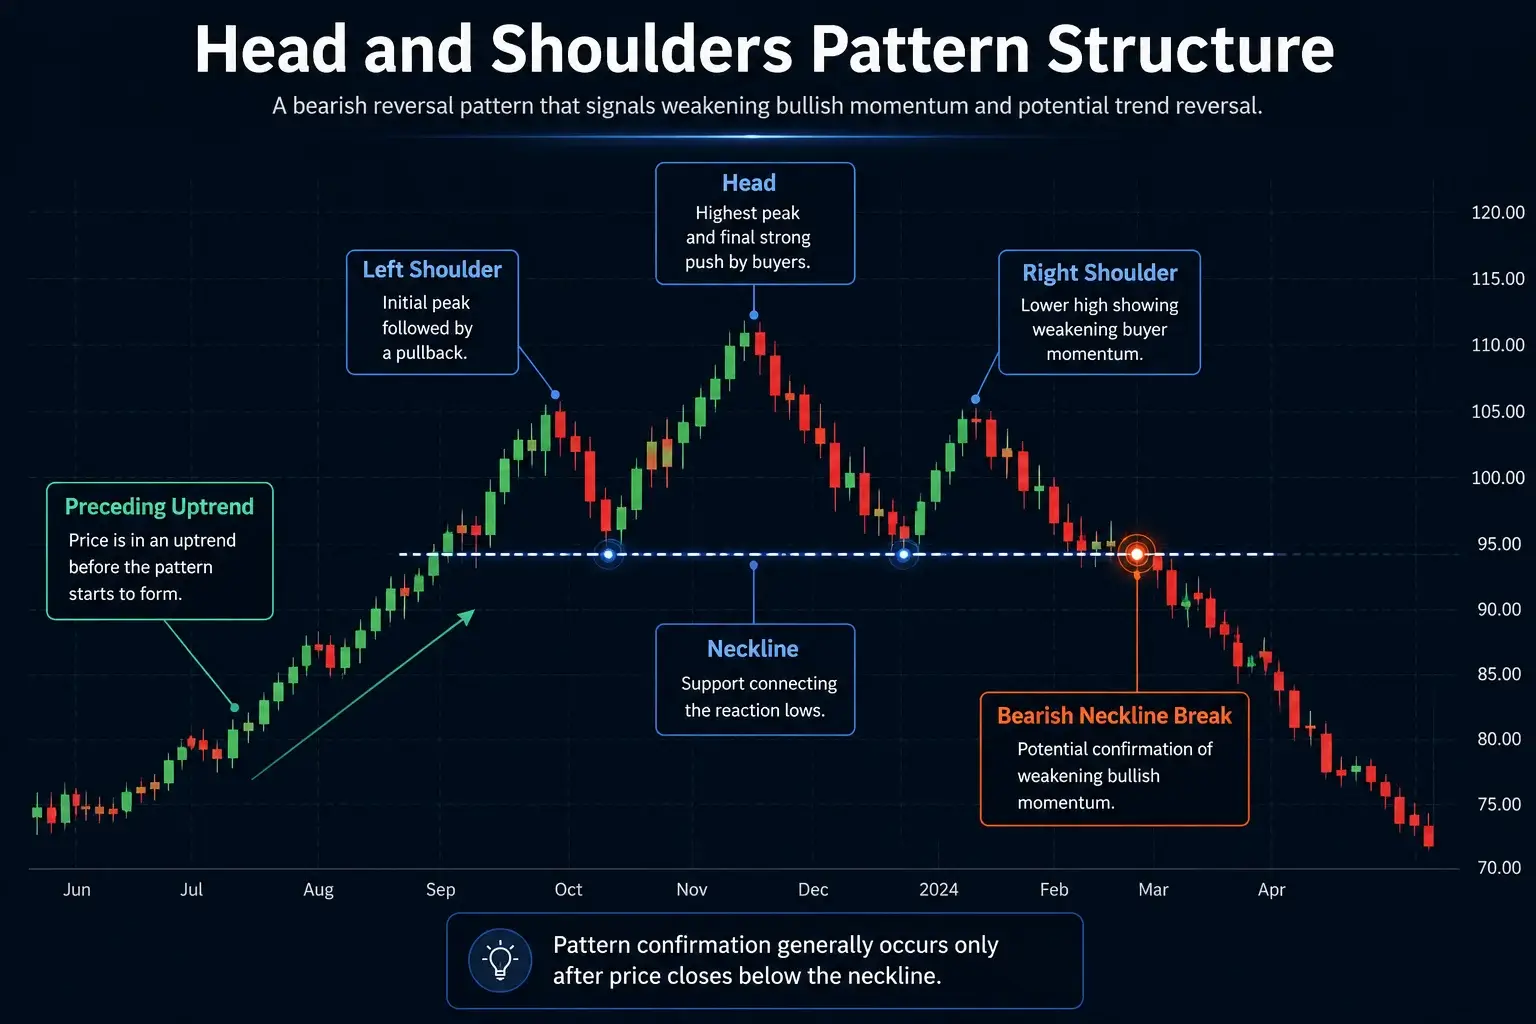
The pattern has three peaks arranged above a baseline called the neckline:
- Left Shoulder: an initial peak formed during a preceding uptrend, followed by a pullback.
- Head: the highest peak in the middle, marking the strongest push from buyers.
- Right Shoulder: a lower high that fails to match the head, showing weakening demand.
- Neckline: a support level connecting the reaction lows between the peaks; see support and resistance basics for how these levels are drawn.
If price falls below the neckline, it suggests weakening bullish sentiment and possible downward pressure. The pattern can appear on CFDs across markets — including shares, forex, indices, and commodities — and is used to interpret potential changes in trend behaviour.
Common Variations of the Head and Shoulders Pattern
Real charts rarely draw the pattern perfectly. Common variations you may see include uneven shoulder heights, a slightly sloping neckline, and differences in pullback depth or timing. What matters most is the underlying structure and how price behaves around the neckline, not textbook symmetry.
How Do You Confirm a Head and Shoulders Pattern?
A head and shoulders pattern is not considered complete until price breaks below the neckline. This move suggests the prior uptrend has weakened and the market may be turning bearish.
Confirmation factors some traders consider include:
- A clear neckline break, ideally on a candle close rather than an intraday spike
- Increased selling volume during or after the break
- A retest of the neckline that holds as resistance
Confirmation signals are best analysed within the broader market context rather than used as standalone guidance.
How Volume Confirms a Head and Shoulders Pattern
Volume is the trading volume behind each move, and in classic head and shoulders theory it follows a recognisable path: high on the left shoulder, often lower on the head, and lower still on the right shoulder — a gradual decline that reflects fading buying interest. A pickup in volume on the neckline break is frequently treated as supporting evidence that sellers are taking control.
The typical volume sequence across the formation:
- Left shoulder: volume is usually elevated as the prior uptrend pushes to a new peak.
- Head: price makes a higher high, but volume often fails to exceed the left shoulder, hinting at weaker conviction.
- Right shoulder: volume is commonly the lowest of the three, reflecting reduced participation from buyers.
- Neckline break: a rise in volume on the breakdown is often viewed as stronger confirmation than a break on thin volume.
What if Volume Does Not Decline on the Right Shoulder?
When volume does not fall on the right shoulder — or rises into it — the pattern is generally seen as less reliable. Steady or rising volume on the right shoulder can indicate that buyers have not yet withdrawn, which is one reason many technical analysts wait for the neckline break and its accompanying volume before treating the formation as confirmed.
It does not automatically invalidate the pattern, but it lowers the weight some traders place on it. Volume behaviour is best read as one input among several, not a rule in isolation.
What Does the Head and Shoulders Pattern Indicate?
The head and shoulders pattern reflects a gradual shift in market psychology. Early on, buyers keep pushing price higher, but each rally shows less strength. Sellers then step in more aggressively, creating the lower high that forms the right shoulder.
Viewed through trader psychology, the three stages read as:
- Left Shoulder: buying confidence remains, but early signs of hesitation appear.
- Head: buyers make one final strong push to a new high.
- Right Shoulder: the failure to retest the head’s high suggests fading momentum.
When price moves below the neckline, it reinforces the idea that buyer enthusiasm has diminished and sellers may be gaining control.
For example, Tesla’s share price traced a classic head and shoulders in past market cycles, with initial optimism giving way to consolidation and declining momentum before a break lower [1]. Traders accessing this move through a share CFD would speculate on the price change without owning the underlying stock.
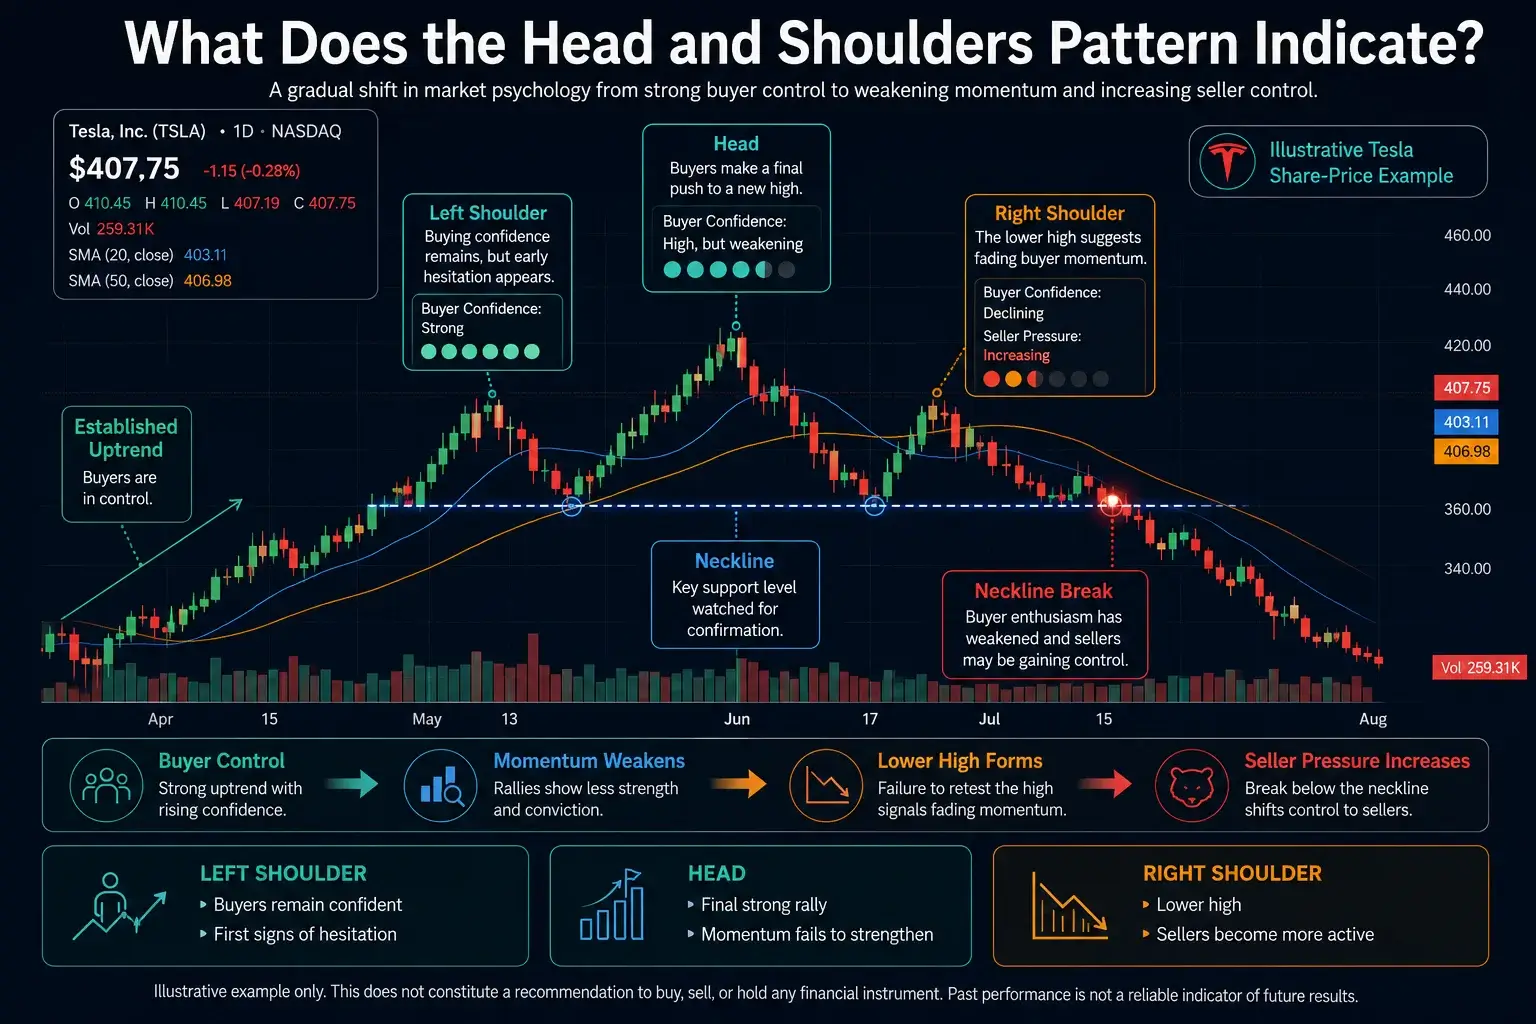
The above example is for illustrative purposes only and does not constitute a recommendation to buy, sell, or hold any financial instrument. It has been selected solely to demonstrate how the pattern may appear on a price chart. Past performance is not a reliable indicator of future results.
Neckline Slope: Flat vs Sloping
The neckline is the support line connecting the reaction lows on either side of the head, and its angle affects how the pattern is read. A neckline can be flat, upward-sloping, or downward-sloping — all are technically valid, but each carries a slightly different reliability profile in the eyes of many technical analysts.
| Neckline slope | How it typically reads |
| Flat (horizontal) | Often regarded as the clearest and most reliable version, with an unambiguous break level. |
| Upward-sloping | Common in strong prior uptrends; the break may come later and require closer confirmation. |
| Downward-sloping | Rarer; can signal earlier weakness but is sometimes harder to distinguish from other patterns such as a falling wedge. |
Slope is a matter of interpretation rather than a fixed rule. A steeply sloping neckline can blur the line between a genuine head and shoulders and a different formation, which is why some traders lean on flat necklines for cleaner signals.
What Is an Inverse Head and Shoulders Pattern?
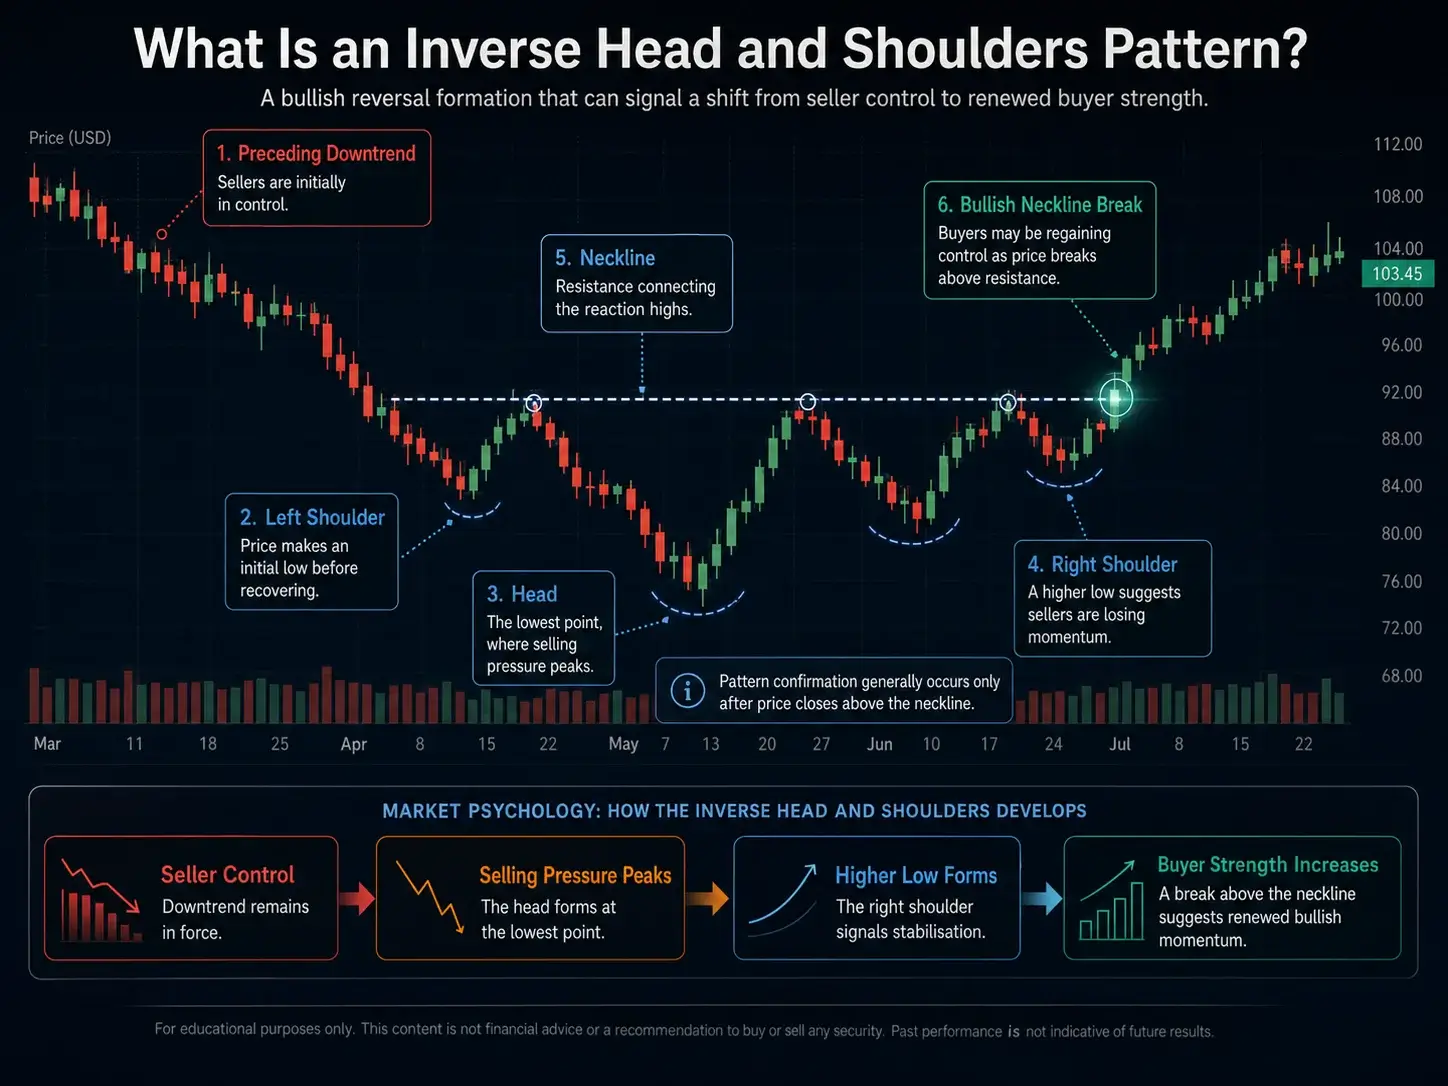
The inverse head and shoulders pattern is a bullish reversal formation that mirrors the standard version, typically signalling a bearish-to-bullish shift in market sentiment. Both patterns share the same structural logic but are flipped in orientation and implication.
The inverse pattern forms when:
- Price makes a low (left shoulder)
- Followed by a lower low (head)
- Then a higher low (right shoulder)
- All beneath a horizontal or slightly sloping neckline
Once price breaks above the neckline, many market participants read it as a sign that sellers are losing control and buyers are regaining strength.
Inverse Head and Shoulders Measured Move
The measured move for an inverse head and shoulders works the same way as the standard pattern, but projects upward. Measure the vertical distance from the head (the lowest low) up to the neckline, then add that distance to the neckline break point to estimate a possible target zone.
For example, if the head sits at USD100 and the neckline at USD115, the USD15 distance added to a break at USD115 projects a target around USD130. As with all projections, the target is a guideline rather than a guarantee.
Is the Head and Shoulders Pattern Reliable?
The head and shoulders pattern is widely recognised in technical analysis, but its reliability depends on context, structure, and confirmation. The table below summarises the main advantages and disadvantages before exploring them in detail.
| Advantages | Disadvantages |
| Clear and recognisable three-peak structure | Imperfect real-world shapes may confuse beginners |
| Suits both discretionary and rule-based analysis | False breakouts can occur; confirmation is needed and it should not be used as a standalone signal |
| Appears across multiple markets and timeframes | Stop-loss distances between head and neckline may be wide |
Advantages of the Head and Shoulders Explained
While no chart pattern guarantees outcomes, the head and shoulders formation can offer practical advantages that support structured analysis in an educational context.
1. Clear Structure
The three-peak formation is relatively distinct, which may make it easier to identify even when real charts show slight asymmetry or a tilted neckline.
2. Logical Risk and Reference Levels
The neckline break provides a commonly watched reference point, while the right-shoulder high (or low, for inverse patterns) often serves as a logical area for defining risk. These zones can support a more structured approach to analysing the chart.
3. Potential for Meaningful Trend Shifts
Because head and shoulders patterns often form over extended periods, the moves that follow a confirmed reversal can unfold across significant price distances. Outcomes vary, but the pattern is often used to highlight potential changes in momentum.
Disadvantages of the Head and Shoulders to Look Out For
The pattern also has limitations. Real conditions rarely produce perfect structures, and breakouts can behave differently depending on volatility, liquidity, and broader market sentiment.
1. Real-Market Imperfections
Necklines may slope, shoulders may be uneven, and volume may not follow the ideal script. These variations can make the pattern harder to interpret for beginners who expect a perfect diagram.
2. Potentially Wide Stop-Loss Placement
The vertical distance between the head and the neckline can create wider stops than some traders would prefer, especially in volatile markets, where leverage can magnify both gains and losses.
3. Retests Can Create Uncertainty
A neckline break followed by a sharp retest can make it difficult to judge whether the move is genuine or a temporary spike. Think of it as a door that swings open, then briefly nudges back before closing. This uncertainty may lead to premature entries or exits.
What Are the Common Head and Shoulders Mistakes to Avoid?
Based on technical literature, four common mistakes recur:
- Entering before the neckline breaks (premature confirmation)
- Ignoring volume behaviour, particularly on the right shoulder
- Forcing the pattern onto unrelated price action
- Treating the pattern as a guarantee rather than one tool among many
What Happens if the Head and Shoulders Pattern Fails?
A head and shoulders pattern is considered failed when price breaks below the neckline — suggesting a bearish continuation — but then quickly reverses and pushes back above it. This behaviour indicates sellers could not maintain control and buyers may be stepping back in with stronger momentum. A failed head and shoulders can sometimes imply a shift in sentiment away from the expected bearish scenario, and in some cases resolves into a bullish continuation of the prior trend.
When a failure occurs, some traders respond by:
- Waiting for a confirmed candle close back above the neckline before reassessing
- Watching for a successful retest of the neckline from above, which can support the idea of renewed bullish interest
- Using tighter stops or reduced position sizing due to the potential for volatility
Morning Star on the Right Shoulder
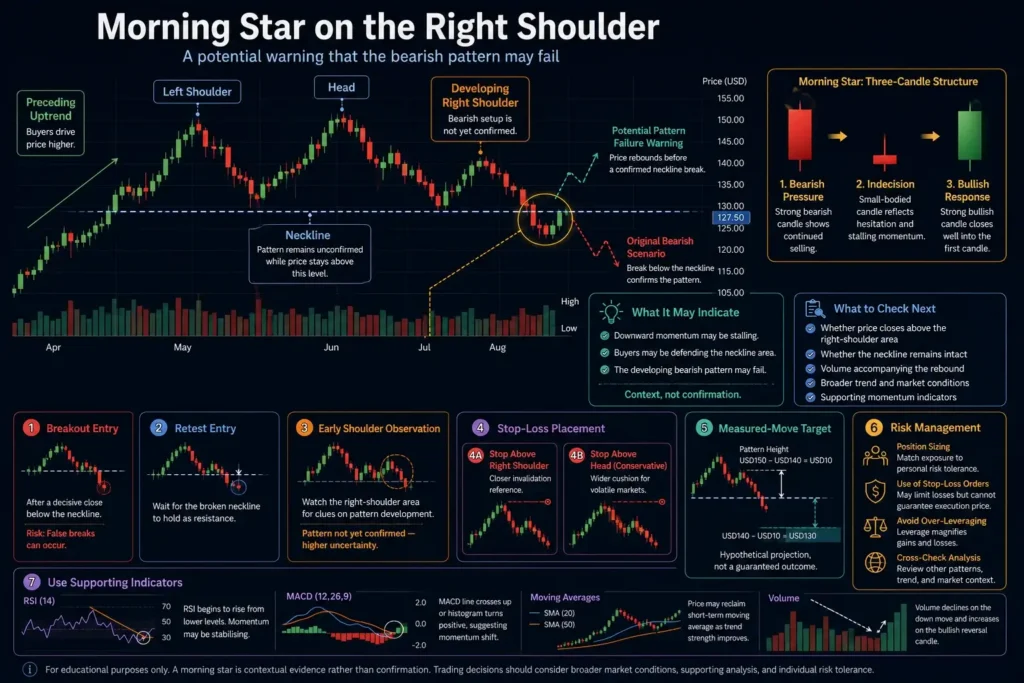
One specific failure signal that draws attention is a bullish reversal candle — such as a morning star — forming on the right shoulder. A morning star is a three-candle candlestick pattern that often points to a potential bottom. When it appears on the right shoulder of a developing head and shoulders, it can hint that downward momentum is stalling before the neckline even breaks, which some traders read as an early warning that the bearish setup may not play out. As always, a single candle is context rather than confirmation.
Trading decisions around failed patterns should incorporate the broader market context and supporting tools rather than relying on the failure signal alone.
7 Head and Shoulders Pattern Trading Approaches to Explore
The head and shoulders pattern is often analysed for structured entry, risk, and confirmation techniques.
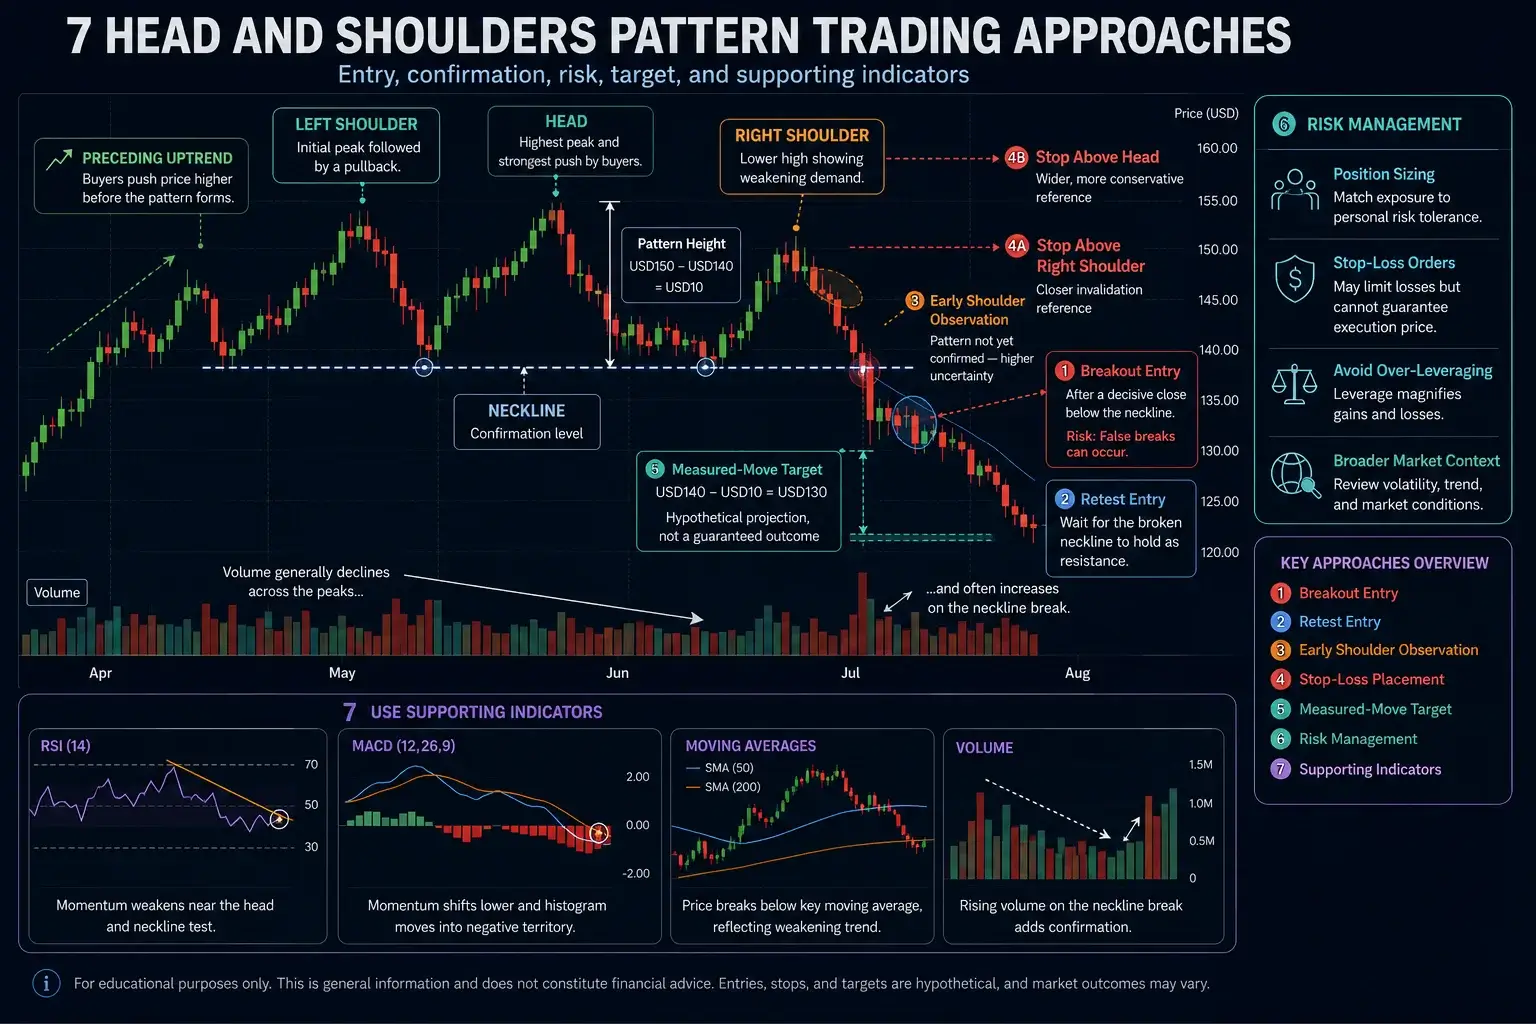
The approaches below describe common analytical methods discussed in technical analysis and are presented for educational purposes only. They should not be regarded as trading recommendations.
1. Breakout Entry
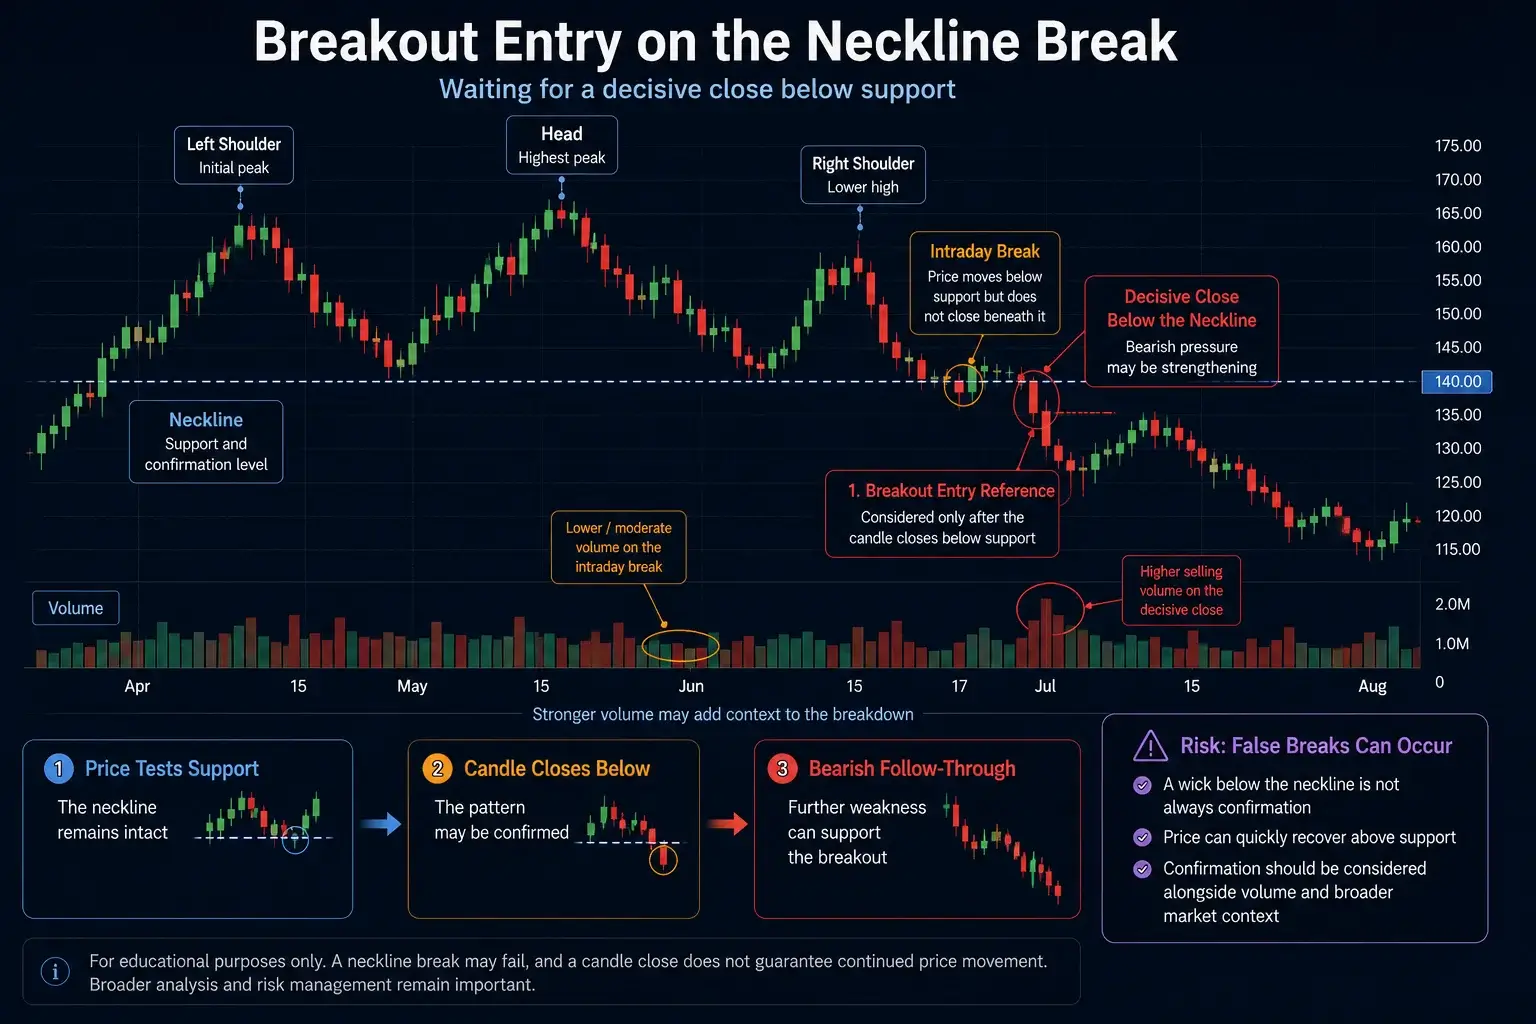
One commonly discussed approach is to wait for price to close decisively below the neckline. This movement may indicate that selling pressure has strengthened and that the pattern has been confirmed.
However, neckline breaks do not always lead to a sustained downward movement. Market participants may therefore assess the strength of the close, trading volume, and broader market conditions before interpreting the break.
Risk Note: confirmation is important, as false breaks can occur.
2. Retest Entry
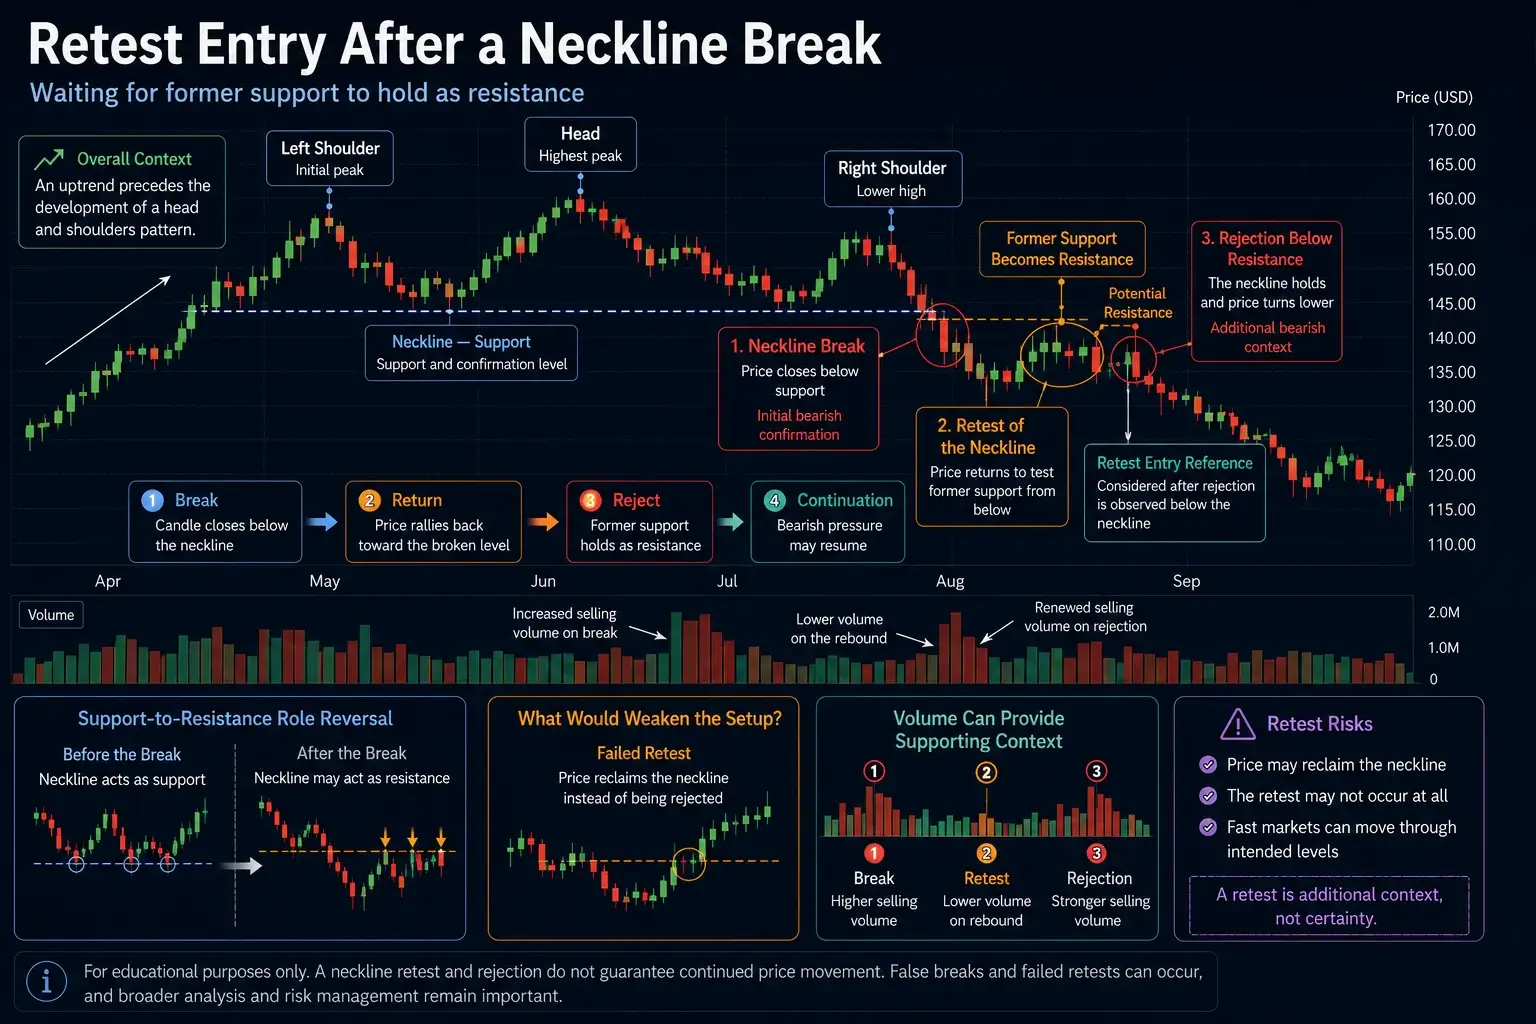
A more conservative approach is to wait for price to break the neckline and then retest it from below. If the neckline holds as resistance, the retest is often interpreted as additional confirmation.
3. Early Right-Shoulder Entry
Some market participants observe price action around the right shoulder before the neckline has been broken. This may provide an earlier entry point, but it involves greater uncertainty because the pattern remains incomplete and unconfirmed.
Price may recover, move above the head, or develop into a different chart formation. For this reason, movements around the right shoulder are generally treated as early analytical context rather than confirmation of a completed head and shoulders pattern.
For educational purposes, early-formation movements are generally safer viewed as context rather than a trade signal on their own.
4. Stop-Loss Placement
Stop-loss placement helps define where the head and shoulders pattern would be considered invalid. Common approaches include:
- Above the Right Shoulder: a break above this point likely invalidates the bearish structure.
- Above the Head (more conservative): provides a wider cushion for volatile markets but requires accepting greater risk.
Rather than relying on the pattern’s geometry alone, stop-loss decisions are best made with market volatility, timeframe, and individual risk tolerance in mind.
5. Calculate the Measured-Move Target
When estimating a potential target for the standard head and shoulders, many market participants use the measured-move approach:
- Measure the vertical distance between the head and the neckline.
- Subtract that distance from the neckline break point to estimate a possible target zone.
Example: with a head at USD150 and a neckline at USD140, the USD10 distance subtracted from the USD140 break projects a target around USD130. This example is hypothetical and for illustrative purposes only. It does not reflect actual trading results or client experiences.
Targets should be treated as guidelines rather than guarantees, since price behaviour varies across instruments and market conditions.
6. Apply Risk Management Techniques
Risk management addresses how much exposure a trader accepts, separately from where stops or targets sit. Key factors include:
- Position Sizing: adjusting trade size to fit personal risk tolerance.
- Use of Stop-Loss Orders: helping to cap potential losses, though they do not guarantee execution at the set level in fast markets.
- Avoiding Over-Leveraging: excessive leverage magnifies both gains and losses.
- Cross-Checking With Broader Analysis: reviewing other chart patterns, trend context, and market conditions to avoid relying on one pattern alone.
This is general information only and does not constitute financial advice. Individual circumstances vary.
7. Use With Other Technical Indicators
Like any chart formation, the head and shoulders pattern is best not used in isolation. Supplementary technical indicators can add context on trend strength, momentum, and participation around the neckline.
- Relative Strength Index (RSI): the RSI may highlight changes in momentum; weakening RSI near the head or a neckline test can reflect slowing bullish strength.
- Moving Average Convergence Divergence (MACD): the MACD may support the idea of a potential trend transition through momentum shifts or histogram changes.
- Moving Averages (MAs): short- or medium-term averages can illustrate broader trend direction around the pattern.
- Volume Indicators: monitoring volume around the neckline offers additional insight into market participation.
Platforms such as TradingView, available through Vantage, let traders mark neckline breaks and track volume during fast-moving markets. These indicators are best viewed as supporting context within a broader analytical approach rather than standalone guidance.
Bringing the Head and Shoulders Pattern Into Context
The head and shoulders pattern remains one of the most recognisable structures in technical analysis, offering insight into when momentum may be shifting from buyers to sellers. Rather than providing signals on its own, it acts as a visual framework for interpreting changes in sentiment across CFD markets including shares, forex, commodities, and indices.
Its effectiveness depends on broader context — trend conditions, volume behaviour, volatility, liquidity, and supporting analysis — and it works best alongside sound risk management.
Practising on a Vantage Demo Account can help build familiarity with identifying the pattern and observing how neckline breaks, retests, and volume behave. Vantage’s MetaTrader 4 and 5 platforms offer charting tools that support this analysis. Traders who choose to open a Vantage Live Account should ensure they fully understand the risks involved and whether CFD trading is appropriate for their circumstances. Terms and conditions apply.
Frequently Asked Questions (FAQ)
What is a head and shoulders pattern?
A head and shoulders pattern is a chart formation of three peaks — a higher central head between two lower shoulders — that sits above a support line called the neckline. It typically appears after an uptrend and is viewed as a potential bearish reversal signal. The pattern is only considered complete once price closes below the neckline.
Is the head and shoulders pattern bullish or bearish?
The standard head and shoulders pattern is generally viewed as bearish, signalling a potential shift from buying strength to selling pressure. Its opposite, the inverse head and shoulders, is the bullish version, often associated with a potential upward reversal. Which one you are looking at depends on whether the peaks point up (bearish) or the troughs point down (bullish inverse).
Does volume have to decline for the pattern to be valid?
In classic theory, volume tends to decline across the three peaks and rise on the neckline break, and many technical analysts treat that sequence as supporting evidence. When volume does not decline on the right shoulder, the pattern is often seen as weaker or unconfirmed rather than automatically invalid. Volume is best read as one confirmation input among several, not a strict rule.
What happens after a head and shoulders pattern forms?
If the pattern completes and price breaks the neckline, it may continue lower towards a projected zone based on the pattern’s height. Market outcomes vary, so this projection is a guideline rather than a guarantee. Effective risk management remains important because the move can undershoot, overshoot, or reverse.
What does a failed head and shoulders pattern mean?
A failed head and shoulders occurs when price breaks below the neckline but then quickly reverses back above it, suggesting sellers could not hold control. In some cases the failure resolves into a bullish continuation of the prior trend. Signals such as a morning star forming on the right shoulder can hint at fading downward momentum before the pattern completes.
What timeframe is best for a head and shoulders pattern?
The pattern can appear on any timeframe, but it is often clearer on higher intervals such as daily, weekly, or monthly charts. Longer timeframes tend to reduce short-term noise, which can make the head, shoulders, and neckline easier to identify. Lower timeframes produce more frequent setups but are more prone to false breakouts.
How do you draw the neckline on a head and shoulders pattern?
The neckline is drawn by connecting the two reaction lows that form between the shoulders and the head. It can be flat, upward-sloping, or downward-sloping, and all three are technically valid. A flat neckline is often considered the clearest to trade because the break level is unambiguous.
RISK WARNING: CFDs are complex financial instruments and carry a high risk of losing money rapidly due to leverage. You should ensure you fully understand the risks involved and carefully consider whether you can afford to take the high risk of losing your money before trading.
Disclaimer: The information is provided for educational purposes only and doesn’t take into account your personal objectives, financial circumstances, or needs. It does not constitute investment advice. We encourage you to seek independent advice if necessary. The information has not been prepared in accordance with legal requirements designed to promote the independence of investment research. No representation or warranty is given as to the accuracy or completeness of any information contained within. This material may contain historical or past performance figures and should not be relied on. Furthermore estimates, forward-looking statements, and forecasts cannot be guaranteed. The information on this site and the products and services offered are not intended for distribution to any person in any country or jurisdiction where such distribution or use would be contrary to local law or regulation.
References
- “Unlocking Tesla’s Secrets: The Power Of Price Patterns Exposed – Forbes” https://www.forbes.com/sites/jonmarkman/2023/08/14/unlocking-teslas-secrets-the-power-of-price-patterns-exposed/ Accessed 2 July 2026